RESULTS OF THE AMERICAN COMMUNITY SURVEY FOR 2011: a comparison of the results for the years 2010 and 2011 contrasting the total population of the United States and Mexican American professionals
By HUMBERTO (TITO) GUTIERREZ
Edited by Corrie Cripps
Mexican American women have been making slow but steady gains in business, science and art management jobs over the past few years, according to statistics from the 2011 American Community Survey conducted by the U.S. Census Bureau. However, Mexican American professionals continue to be underrepresented among the total U.S. professional population. This brief identifies areas of interest in the 2011 American Community Survey to Mexican American professionals.
Note: The statistics in this brief refer to the population who reported themselves as Mexican Americans on the American Community Survey.
According to the Survey, the total population of the U.S. is 311,591,919.
The Mexican American population is 33,557,922, roughly 10.8% of the total U.S. population.
College and/or Graduate School Enrollment
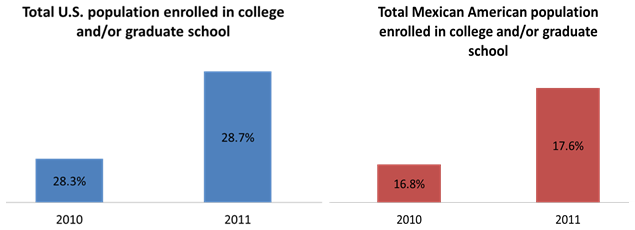
- 28.3% of the total population was enrolled in college or graduate school in 2010. In 2011, this number increased to 28.7%.
- 16.8% of the Mexican American population was enrolled in college or graduate school in 2010. In 2011, this number increased to 17.6%.
Charts: Total population enrolled in college and/or graduate school, Total U.S. population vs. Total Mexican American population

Educational Attainment:
- 17.7% of the total population earned bachelor degrees in 2010. In 2011, this number increased to 17.9%.
- 6.7% of the Mexican American population earned bachelor degrees in 2010. In 2011, this number increased to 6.9%.
- 10.4% of the total population earned graduate and professional degrees in 2010. In 2011, this number increased to 10.6%.
- 2.6% of the Mexican American population earned graduate and professional degrees in 2010, and this percentage remained the same in 2011.
Table: Educational attainment, bachelor degrees or higher
Note: In the following chart, each statistic stands for itself, i.e. do not add the male percentage to the female percentage to get a total.
Persons with a bachelor’s degree or higher are those who have received a bachelor’s degree from a college or university, or a master’s, professional, or doctorate degree.
| 2010 | 2011 | |||
| Total Population | Mexican American | Total Population | Mexican American | |
| Graduate or professional degree | 10.4% | 2.6% | 10.6% | 2.6% |
| Bachelor’s degree or higher | 28.3% | 16.8% | 28.7% | 17.6% |
| Males with bachelor’s degree or higher | 28.5% | 8.4% | 28.7% | 8.6% |
| Females with bachelor’s degree or higher | 27.9% | 10.4% | 28.3% | 10.6% |
OCCUPATIONS
Note: this data in this section includes only persons 25 years of age and older. The percentages are obtained by dividing the counts of graduates by the total number of persons 25 years old and over.
Occupations: Female employed civilians, age 25 and older:
- 39.4% of the total population of women in 2011 were employed in management, business, science, and arts occupations. Mexican American women represent 22.1% of the Mexican Americans employed in management, business, science, and arts occupations.
- Between 2007 and 2011, there has been a 1.7% increase (20.4% to 22.1%) in the number of Mexican American women employed in management professional and related occupations. In this area, the female general population figure has increased from 37.9% in 2007 to 39.5% in 2011, a 1.6% increase.
Occupations: Male employed civilians, age 25 and older:
- Between 2007 and 2011, there has been a 1.7% increase in the number of Mexican-American males in management and professional occupations.
Table: Occupations, Civilian employed population, age 25 and older
| 2010 | 2011 | |||
| Total Population | Mexican American | Total Population | Mexican American | |
| Management, business, science, and arts occupations | 35.9% | 16.2% | 36.0% | 16.4% |
| Males in management, business, science, and arts occupations | 32.8% | 12.4% | 32.7% | 12.5% |
| Females in management, business, science and arts occupations | 39.4% | 21.7% | 39.5% | 22.1% |
Industry: Civilian employed population 16 years and older:
- 10.6% of the general population was employed in the professional, scientific, management, administrative and waste management services in 2010. In 2011, this number only increased by .1% to 10.7%.
- 10.1% of Mexican Americans were employed in the professional, scientific, management, administrative and waste management services in 2010. In 2011, this percentage remained the same.
Public Administration:
- In 2010, the total population was 5.2% in public administration and 3.5% for Mexican Americans.
- In 2011, the total population was 5.1% in public administration and 3.4% for Mexican Americans. As with the Industry statistics, there was virtually no change from 2010 to 2011 in this area.
SUMMARY
Comparison of the 2010 and 2011 ratios of professionals in the general population and in the Mexican American population shows little change. In general, graduate and professional degrees among the total population are more than triple when compared with Mexican Americans who have earned graduate or professional degrees. On the bright side, there is at least one area where the ratio is almost equal; women have, again, gained ground in business, science and art management.
Reference Documents from the U.S. Census Bureau, American Community Survey
- Census Bureau, Selected Population Profile in the United States: 2011 (a PDF file)
- United States S0201. Selected Population Profile in the United States (search page)
Population Group: Mexican
Data Set: American Community Survey 1-Year Estimates (for years 2007, 2010, and 2011) - United States S0201. Selected Population Profile in the United States (search page)
Population Group: Total Population
Data Set: American Community Survey 1-Year Estimates (for years 2007, 2010, and 2011)


