

5 Latinos Forging New Ground and Breaking Barriers
We’re all familiar with prominent Latinos who have broken barriers to become national and international household names – from Rita Moreno and Gloria Estefan to JLo and Pitbull. Or think Sonia Sotomayor or Pulitzer prize-winner Junot Díaz.
Here’s a small list of Latinos who are breaking barriers in their professions and leaving their mark as they shake things up. They range from ranging from multi-millionaire techies to VJs and Vine stars. They’re in different stages of their trajectories, and they’re all fascinating…
Link to article
Job Opportunities for Latinos — Marketing Specialist
Information is the key to success these days especially in business. Most companies, entrepreneurs and organization are even willing to spend millions just to gather important details they can use to know more and understand their customers. That’s why jobs that are inclined to its niche, like Market Specialists, have a projected demand increase of about 41 percent from 2010 to 2020…
Link to article
From the Delano Grape Strike to the Mexican American Vintners Association
By Humberto Gutierrez
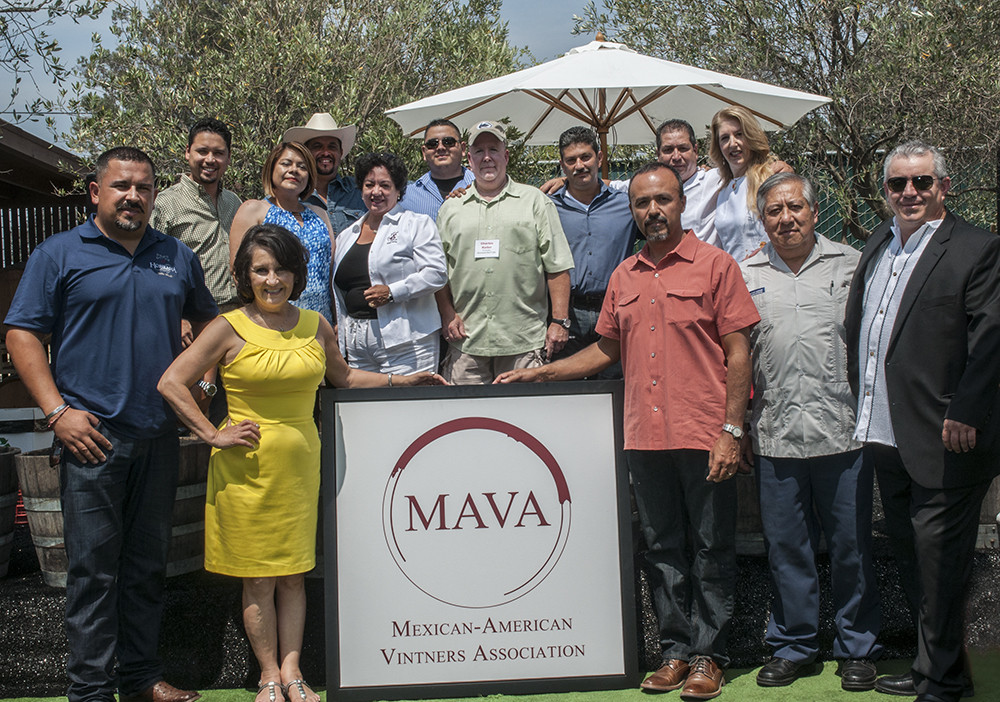
There have been several longitudinal studies on Mexican American mobility showing that although the monetary movement of Mexican Americans is not quite as rapid as that of whites, there is still a steady accumulation of wealth across generations.
This mobility is evidenced by the progress made by Mexican American professionals. As evidence of this success, we have witnessed the birth of several prominent professional associations. Most notable are:
- MAES, Latinos in Science and Engineering
- AMAE, Association of Mexican American Educators
- MABA, Mexican American Bar Association
- SACNAS, Society for Advancement of Chicanos and Native Americans in Science
- MAHPA, Mexican American Hispanic Physicians Association
- MABPA, Mexican American Business and Professional Association
- MALFA, Mexican American Latino Faculty Association
- MAVA, Mexican American Vintners Association
The latest American Community Survey shows year-to-year progress, or lack of it, on the survey’s annual census.
Prominent among this year is the continued progress of Mexican American college enrollment, which has jumped from 18.1% in 2013 to 18.7% in 2014. Unfortunately, graduate or professional degrees remain low with a small gain. For 2013, the graduate or professional degree was 11.2% and for 2014 this percentage climbed to 11.4% for the total population, while for 2013 it was 2.8% for Mexican Americans, and 2.9% for 2014.

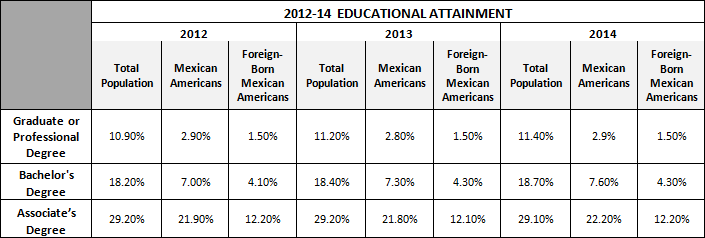
Occupations in management, business, science, and arts showed a nice increase for Mexican Americans, from 16.7% to 17.4% while for the total population percentages went from 36.3% in 2013 to 36.9% in 2014. Mexican Americans still lag far behind the total population but there is a slight gain as compared to the total population.

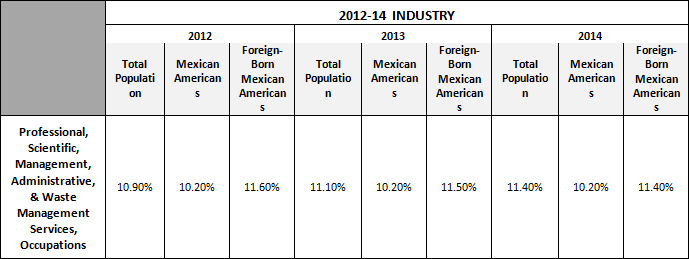
For industry, numbers have gone up slightly for the total population but have remained stagnant for Mexican Americans.
References
- Census Bureau, Selected Population Profile in the United States: 2014
- United States S0201 and B05006. Selected Population Profile in the United States
- Population Groups: Mexican and Mexico (foreign-born)
- Data Set: American Community Survey 1-Year Estimates for years 2012 and 2014
- Census Bureau, American Fact Finder, Selected Population Profile in the United States
Slow and Steady Progress for Mexican American Professionals: The results of the American surveys for the years 2010-2012 show positive results
By Humberto Gutierrez
Edited by Kristen House
College enrollment showed an increase of 1.4 percent from 2010 to 2012—a positive sign for Mexican Americans wanting to achieve higher academic and professional goals. Here is the data.

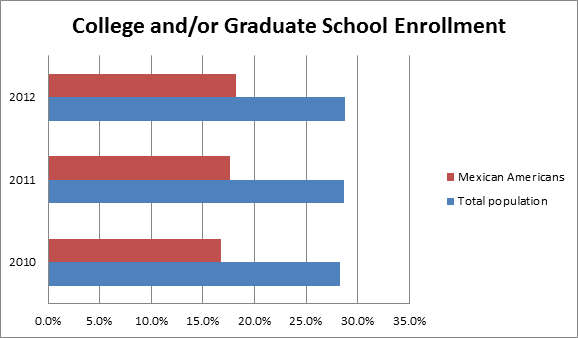
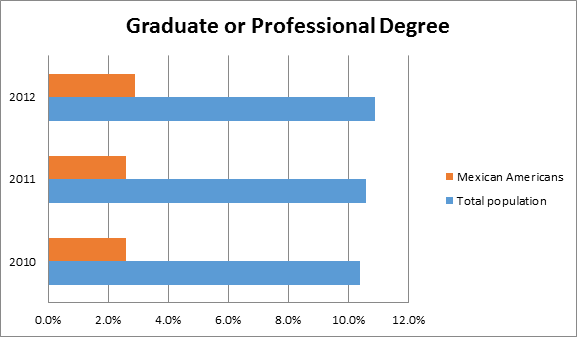
Educational attainment shows no change to the terrible numbers of 2.6 percent for the years 2010 and 2011 but there is hope in that 2012 showed a small gain to 2.9 percent.

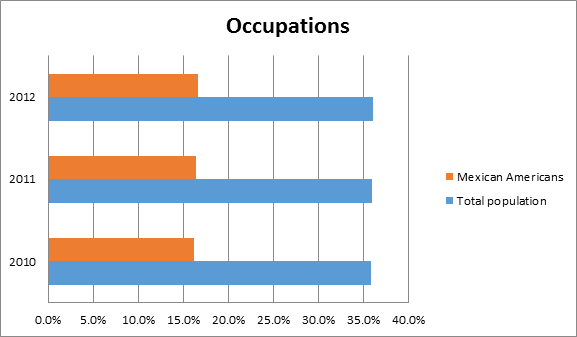
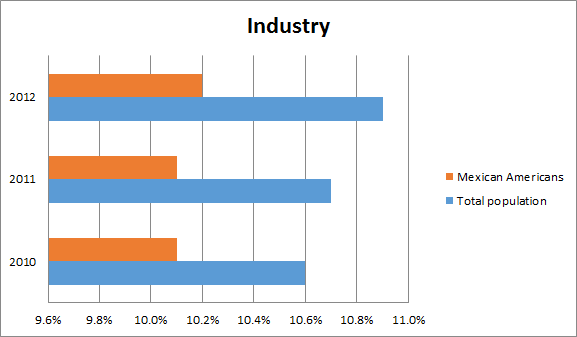
For occupations, there was a .2 percent increment yearly, but still shows that in management, business, science, and art occupations, there is still a wide gap between the total population at 36.1 percent for the year 2012 and 16.6 percent for Mexican Americans.

For professional, scientific, and management and administrative and waste management services, there is a close correlation between the percentage represented by the total population and Mexican Americans.

Summary:
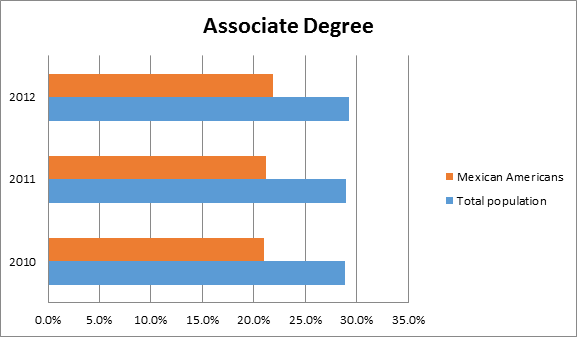
There is hope at the end of the tunnel. College and university enrollment has been trending higher for Mexican Americans. Unfortunately, the percentage of students with graduate degrees stayed the same for the years 2010 and 2011, but rose a small amount in 2012. Percentages showing students with BA and AA degrees trended higher—an encouraging sign. Occupations still showed a wide margin between the total population and Mexican Americans. The Mexican American population showed a small increase in professional, scientific, and management and administrative and waste management employment while the total population showed a small but steady increase in this area.
References:
- Census Bureau, Selected Population Profile in the United States: 2010 – 2012
- United States S0201. Selected population Profile in the United States
- Population Group: Mexican and Total Population
- Data Set: American Community Survey 1-Year Estimates
Employment & Job News 2014: US Employers Hire 321,000 Employees in November; Latino Unemployment Drops Slightly
Employment & Job News 2014: US Employers Hire 321,000 Employees in November; Latino Unemployment Drops Slightly
U.S. employers hired 321,000 people in November, the latest sign of steady growth and health job gains. The latest job figures mean 2014 is on track to be the strongest year for hiring since 1999, and 10 million jobs were lost during the financial crisis in 2008.
More jobs, 44,000, were added in September and October than had previously been estimated. The Department of Labor said the unemployment rate remained at a six-year low of 5.8 percent.
Economy analysts say job gains will accelerate improvement in the labor market as more industries participate in the recovery. The Labor Department measured a 69.7 percent rate increase in its Diffusion index which measures industry payrolls…
Link to article
Hopeful Gains in Higher Education for Mexican Americans
By Humberto Gutierrez
Edited by Kristen House
The latest figures from the 2013 American Community Survey show progress in the wide gap between the total US professional population and Mexican Americans:
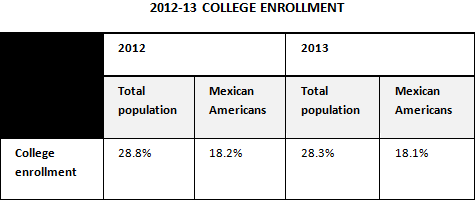
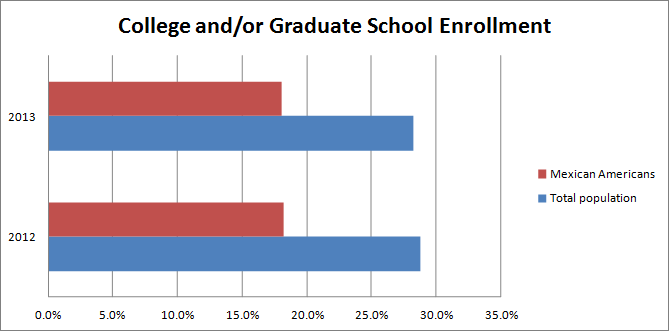
- 2012 college and/or graduate enrollment was 28.8% for the total population but only 18.2% for Mexican Americans.
- 2013 college and/or graduate enrollment was 28.3% for the total population, 18.1% for Mexican Americans, and 33.3% for foreign-born Mexican Americans.
College enrollment for the total population has decreased from the years 2012 to 2013 by 463,000 according the Census Bureau as stated in their Sept. 24, 2014 press release.
For Mexican Americans, there was also an enrollment decrease, but not as pronounced. Mexican American enrollment dropped by only .1% whereas for the total population, there was a .5% drop in college enrollment.
EDUCATIONAL ATTAINMENT
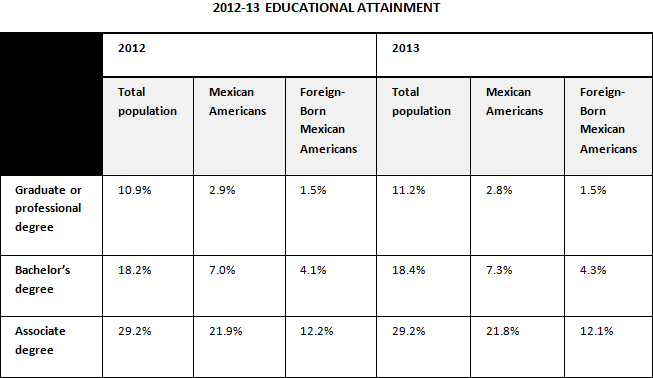
Educational attainment for the general population has risen by .3% from the years 2012 to 2013. For Mexican Americans, it has decreased by .1%
Earned bachelor’s degrees for the general population have risen by .2% and a bit more for Mexican Americans at .3%
Associate degrees and/or some college has shown little change across the board.
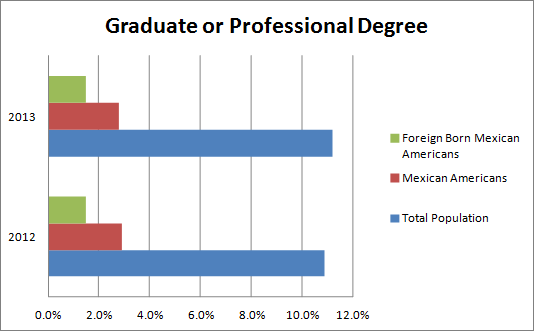
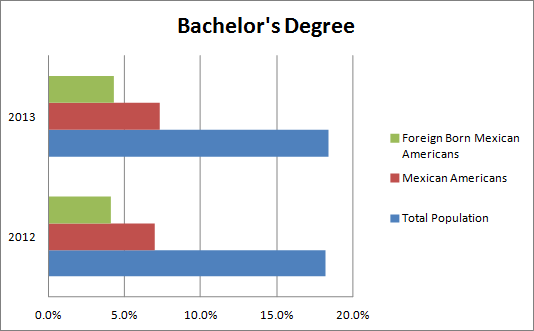
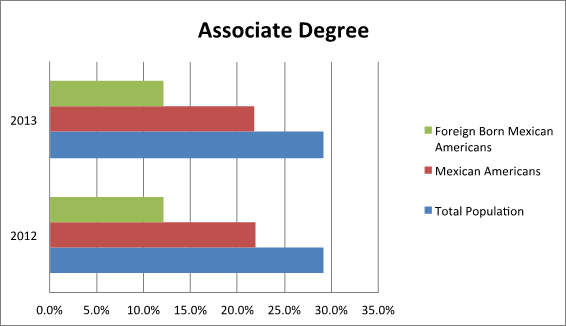
Unfortunately, only 2.8% of Mexican Americans and 1.5% of foreign-born Mexican Americans completed a graduate or professional degree in 2013. This is an extremely low percentage because the total population completion of a graduate or professional degree in 2013 was 11.2%. Why are Mexicans and native-born Mexicans not obtaining their graduate degrees? While only 7.3% of Mexican Americans have B.A. degrees, many are settling for associate degrees—21.8% of Mexican Americans and 12.1% of foreign-born Mexican Americans are ending their academic careers upon achieving these two-year degrees, according to the 2013 data.
OCCUPATIONS
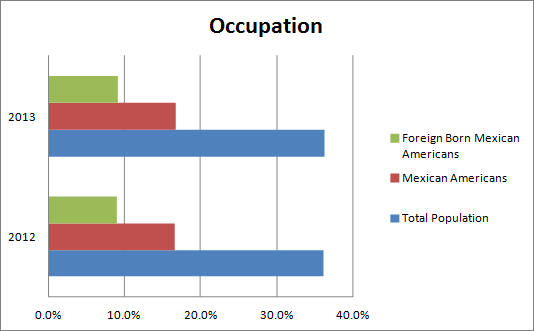
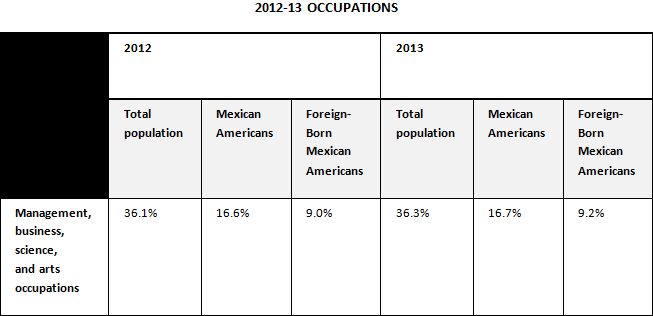
For the year 2013, the data for civilian employed population 16 years and over in management, business, science, and arts occupations is: 36.3% for the total population, 16.7% for Mexican Americans, and 9.2% for foreign-born Mexican Americans. Again, dismal figures.
Compared to the 2012 results, which were for the total population of 36.1% and for Mexican Americans 16.6%, there was a .2% increase for the total population and .1% for Mexican Americans. There was also a .2% increase for foreign-born Mexican Americans. Not much change, but some hope.
INDUSTRY
For professional, scientific, management and administration, and waste management services, 2013 employment for the total population was 11.1% and 10.2% for Mexican Americans, with foreign-born Mexican Americans at 11.5%. The 2012 results were for the total population 10.9% and 10.2% for Mexican Americans with the foreign-born Mexican Americans at 11.6%. No change for Mexican Americans and a .2% increase for the total population. However, a happy surprise: in 2013, foreign-born Mexican Americans topped all groups at 11.5% with a small decrease from 2012.
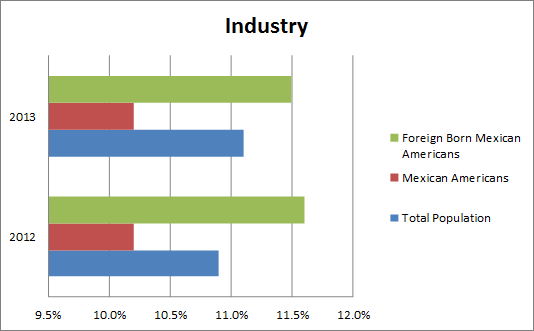
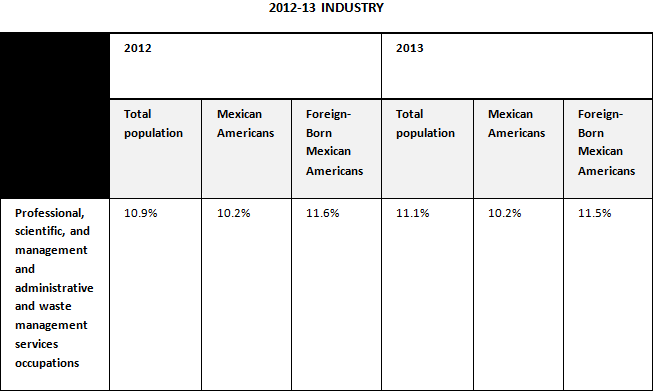
This represents a mixed picture for Mexican Americans and for foreign-born Mexican Americans in their quest for parity with the total population.
Solution for Retaining Minority Students in Higher Education
Scott Watson Swail’s 2003 report (1) on student retention programs in higher education states that a comprehensive student retention program should:
- rely on proven research
- suit the particular needs of the campus
- be institutionalized and become a regular part of campus service
- involve all campus departments and all campus personnel
- take into consideration the dynamics of the change process and provide extensive and appropriate retraining of staff
- be student centered
- operate in a cost-effective way, and not be tied to soft monies
- have the support of a comprehensive student monitoring system that will become the foundation of all institutional research on campus and support every department
- be sensitive to student needs and to diverse populations.
At least some of the above recommendations would go a long way to encourage many minority students to continue their higher education by obtaining a graduate or professional degree.
Berkley, Stanford, UCLA, and Caltech collaborate to boost minority Ph.D. students by recruiting underrepresented students in mathematical, physical and computer sciences, and in engineering.
UC Berkley put it best: “The four schools are creating a unique, cross-institutional community of underrepresented minority Ph.D. students, postdoctoral scholars, and faculty members in the targeted fields; developing faculty training to better recognize and help these students thrive and advance; and conducting research that includes annual surveys of Ph.D. students about what factors impact their attitudes, experiences and preparation for the future.”(2)
References
- Census Bureau, Selected Population Profile in the United States: 2012 and 2013
- United States S0201 and B 05006. Selected population Profile in the United States
- Population groups: Mexican and Mexico (foreign-born)
- Data set: American Community Survey 1-Year Estimates for years 2012 and 2013.
- Census Bureau, American Fact Finder, Selected population Profile in the Untied States.
————————————————–
(1) Watson Scott Swail, Retaining Minority Students in Higher Education: A Framework for Success, George Washington University, 2003
(2) Gretchen Kell, “Berkeley, Stanford, UCLA, Caltech unite to boost number of minority Ph.D. students, faculty,” UC Berkley News Center, February 13, 2014
Upscale and Affluent Latinos Are Tech Savvy, Bilingual and Big Spenders
Upscale and Affluent Latinos Are Tech Savvy, Bilingual and Big Spenders
By Nicole Akoukou Thompson (n.thompson@latinpost.com)
First Posted: Jul 25, 2014 01:17 PM EDT
Guests attend a launch event for Kiva City D.C. hosted by Capital One, Kiva, and the Latino Economic Development Center on January 8, 2013 in Washington, DC
Savvy, affluent and upscale Latinos have soaring purchasing power, and ad campaigns have been working to connect with high-earning Latinos by attempting to understand the preferred media and voice of this segment.
The upsurge in U.S. Hispanic affluence has become more visible within the last two decades. The number of wealthy Latinos (incomes greater than $75,000) doubled from 2000 to 2010, growing at three times the rate of non-Hispanic upscale households. In 2010, there were 2.9 million upscale Latino households, and that number has continued to…
Link to article
Yahoo Diversity Figures Show Lack of Blacks, Hispanics
Yahoo has released information on the diversity of its workforce, and like Google it has a lot of room for improvement.
Last month, Google revealed that only 2% of its workforce was Black, 3% Hispanic and women only 30%.
Yahoo has followed suit by publishing its workforce diversity figures, and they are along the same lines. Women make up 37% of the overall workforce, with blacks representing 2% and Hispanics 4%.
In leadership positions at Yahoo (defined as VP and above), the story is even more lopsided. 77% of those posts are held by men, 2% are held by Hispanics and only 1% by Blacks…
Democratizing Texas Politics: Race, Identity, and Mexican American Empowerment, 1945-2002
B Márquez – 2014
… Page 4. Democratizing Texas Politics Race, Identity, and Mexican American Empowerment,
1945–2002 by benjamin márquez University of Texas Press Austin … Introduction This is a book
about Mexican American incorporation into Texas electoral politics after World War…
Link to preview of book
The Facts on Immigration Today
People from Mexico account for a large part of the undocumented population … which also includes African Americans, women, young people, professionals,…
Link to article
A Demographic Portrait of Mexican-Origin Hispanics in the United States
A record 33.7 million Hispanics of Mexican origin resided in the United States in 2012, according to an analysis of Census Bureau data by Pew Research Center. This estimate includes 11.4 million immigrants born in Mexico and 22.3 million born in the U.S. who self-identified as Hispanics of Mexican origin.
by Ana Gonzalez-Barrera and Mark Hugo Lopez
Mexican-Origin Hispanics in the United States
Link to article
Mexican Roots for Majority of Latino Americans
Mexican Latinos make up more than two thirds of all Latinos in the United States, according to a new Pew Hispanic report.
Of the 51.9 million Latinos living in the United States in 2011, more than 33.5 million trace their family back to Mexico.
The report looked at demographic data collected from the 2011 American Community Survey. The report also examined U.S. citizenship, education levels and median income among U.S. Hispanics.
Link to article
Mexican architect Ricardo Legorreta, known for bold splashes of color and humanism, dies at 80
Ricardo Legorreta, the award-winning Mexican architect who designed the Max Palevsky Residential Commons at the University of Chicago, has died at age 80, the San Antonio Express-News reports.
Link to article
Mexican American integration slow, education stalled, study finds
UCLA report charts Chicano experience over four decades
By Letisia Marquez March 20, 2008
Second-, third- and fourth-generation Mexican Americans speak English fluently, and most prefer American music. They are increasingly Protestant, and some may even vote for a Republican candidate…
Link to article
RESULTS OF THE AMERICAN COMMUNITY SURVEY FOR 2011: a comparison of the results for the years 2010 and 2011 contrasting the total population of the United States and Mexican American professionals
By HUMBERTO (TITO) GUTIERREZ
Edited by Corrie Cripps
Mexican American women have been making slow but steady gains in business, science and art management jobs over the past few years, according to statistics from the 2011 American Community Survey conducted by the U.S. Census Bureau. However, Mexican American professionals continue to be underrepresented among the total U.S. professional population. This brief identifies areas of interest in the 2011 American Community Survey to Mexican American professionals.
Note: The statistics in this brief refer to the population who reported themselves as Mexican Americans on the American Community Survey.
According to the Survey, the total population of the U.S. is 311,591,919.
The Mexican American population is 33,557,922, roughly 10.8% of the total U.S. population.
College and/or Graduate School Enrollment
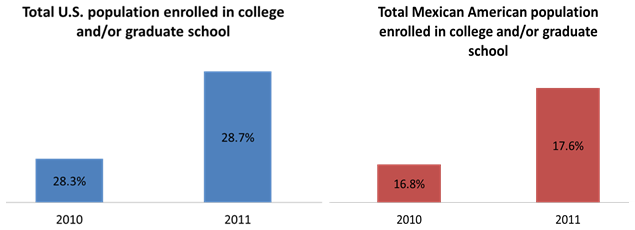
- 28.3% of the total population was enrolled in college or graduate school in 2010. In 2011, this number increased to 28.7%.
- 16.8% of the Mexican American population was enrolled in college or graduate school in 2010. In 2011, this number increased to 17.6%.
Charts: Total population enrolled in college and/or graduate school, Total U.S. population vs. Total Mexican American population
Educational Attainment:
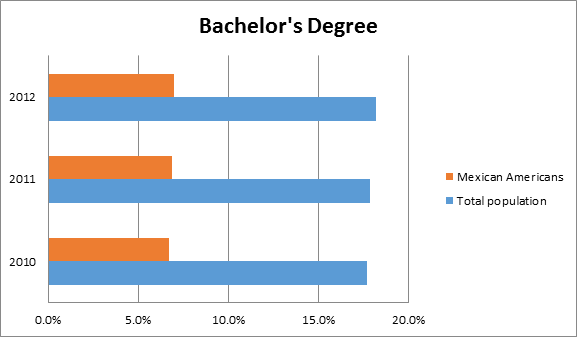
- 17.7% of the total population earned bachelor degrees in 2010. In 2011, this number increased to 17.9%.
- 6.7% of the Mexican American population earned bachelor degrees in 2010. In 2011, this number increased to 6.9%.
- 10.4% of the total population earned graduate and professional degrees in 2010. In 2011, this number increased to 10.6%.
- 2.6% of the Mexican American population earned graduate and professional degrees in 2010, and this percentage remained the same in 2011.
Table: Educational attainment, bachelor degrees or higher
Note: In the following chart, each statistic stands for itself, i.e. do not add the male percentage to the female percentage to get a total.
Persons with a bachelor’s degree or higher are those who have received a bachelor’s degree from a college or university, or a master’s, professional, or doctorate degree.
| 2010 | 2011 | |||
| Total Population | Mexican American | Total Population | Mexican American | |
| Graduate or professional degree | 10.4% | 2.6% | 10.6% | 2.6% |
| Bachelor’s degree or higher | 28.3% | 16.8% | 28.7% | 17.6% |
| Males with bachelor’s degree or higher | 28.5% | 8.4% | 28.7% | 8.6% |
| Females with bachelor’s degree or higher | 27.9% | 10.4% | 28.3% | 10.6% |
OCCUPATIONS
Note: this data in this section includes only persons 25 years of age and older. The percentages are obtained by dividing the counts of graduates by the total number of persons 25 years old and over.
Occupations: Female employed civilians, age 25 and older:
- 39.4% of the total population of women in 2011 were employed in management, business, science, and arts occupations. Mexican American women represent 22.1% of the Mexican Americans employed in management, business, science, and arts occupations.
- Between 2007 and 2011, there has been a 1.7% increase (20.4% to 22.1%) in the number of Mexican American women employed in management professional and related occupations. In this area, the female general population figure has increased from 37.9% in 2007 to 39.5% in 2011, a 1.6% increase.
Occupations: Male employed civilians, age 25 and older:
- Between 2007 and 2011, there has been a 1.7% increase in the number of Mexican-American males in management and professional occupations.
Table: Occupations, Civilian employed population, age 25 and older
| 2010 | 2011 | |||
| Total Population | Mexican American | Total Population | Mexican American | |
| Management, business, science, and arts occupations | 35.9% | 16.2% | 36.0% | 16.4% |
| Males in management, business, science, and arts occupations | 32.8% | 12.4% | 32.7% | 12.5% |
| Females in management, business, science and arts occupations | 39.4% | 21.7% | 39.5% | 22.1% |
Industry: Civilian employed population 16 years and older:
- 10.6% of the general population was employed in the professional, scientific, management, administrative and waste management services in 2010. In 2011, this number only increased by .1% to 10.7%.
- 10.1% of Mexican Americans were employed in the professional, scientific, management, administrative and waste management services in 2010. In 2011, this percentage remained the same.
Public Administration:
- In 2010, the total population was 5.2% in public administration and 3.5% for Mexican Americans.
- In 2011, the total population was 5.1% in public administration and 3.4% for Mexican Americans. As with the Industry statistics, there was virtually no change from 2010 to 2011 in this area.
SUMMARY
Comparison of the 2010 and 2011 ratios of professionals in the general population and in the Mexican American population shows little change. In general, graduate and professional degrees among the total population are more than triple when compared with Mexican Americans who have earned graduate or professional degrees. On the bright side, there is at least one area where the ratio is almost equal; women have, again, gained ground in business, science and art management.
Reference Documents from the U.S. Census Bureau, American Community Survey
- Census Bureau, Selected Population Profile in the United States: 2011 (a PDF file)
- United States S0201. Selected Population Profile in the United States (search page)
Population Group: Mexican
Data Set: American Community Survey 1-Year Estimates (for years 2007, 2010, and 2011) - United States S0201. Selected Population Profile in the United States (search page)
Population Group: Total Population
Data Set: American Community Survey 1-Year Estimates (for years 2007, 2010, and 2011)
Mexican-American Experiences of Vocational Training and Adult Learning after a Layoff Event in San Antonio, Texas
DP Mena, GN McLean
… Given the dearth of literature on Mexican-American displaced workers, it is essential to find
successful interventions that assist this group of … HRD professionals will directly benefit from this
study for this knowledge will minimize emotional impact and prepare employees by …
Link to article-slow in loading
ENGAGING MEXICAN AND MEXICANAMERICAN MOTHERS IN SCHOOLS: USING CULTURE, ACCULTURATION, AND THE SITUATIONAL THEORY OF PUBLICS TO MOTIVATE PARENTAL INVOLVEMENT
LC Perez – 2012
… Page 5. ENGAGING MEXICAN AND MEXICAN-‐AMERICAN MOTHERS IN SCHOOLS: USING
CULTURE, ACCULTURA-‐ … She helped me find a project that would combine my passions and
interests and would help me grow as a professional and as a person. …
Link to theses
MEXICAN AMERICAN FIRST-GENERATION STUDENTS’ PERCEPTIONS OF SIBLINGS AND ADDITIONAL FACTORS INFLUENCING THEIR COLLEGE CHOICE PROCESS
D Elias McAllister – 2012
… Title of Document: MEXICAN AMERICAN FIRST- GENERATION STUDENTS’ PERCEPTIONS
OF SIBLINGS AND ADDITIONAL FACTORS INFLUENCING THEIR COLLEGE CHOICE PROCESS …
choice process of Mexican American first-generation students who had an older …
Link to dissertation
The workers’ camp versus Main Street: then and now in the Mexican-American neighborhoods of the non-metro Midwest
S Dieterlen – Journal of Urbanism: International Research on …, 2012
… characteristics that support this idea include the very high percentages of Mexican-American/
Spanish-language businesses and institutions, their adherence to local non-Hispanic white
appearance standards, the specialized businesses and professional services, the low …
Link to article
New Spanish immersion program in Mexico, offers to take advantage of the Trans-Pacific Partnership (TPP)
San Francisco Chronicle
It’s obvious the bilateral relationship between Mexico and the United States is stronger than ever, but this will have impacts in both economies and cultures and a mexican Spanish school offers a competitive advantage for American professionals. Aiming …
See all stories on this topic »
Link to article


