
The Silent Minority: Mexican-American Professionals
At last, some data
Humberto (Tito) Gutierrez
Since I wrote the first article about Mexican-American Professionals, the Census Bureau has created The American Community Survey (ACS). It …”is part of the Decennial Census Program. It is a survey that is sent to a small percentage of our population on a rotating basis. This data was previously collected only in census years in conjunction with the decennial census. Since the ACS is conducted every year, rather than once every ten years, it will provide more current data…” Given this fact, statistical information about Mexican-Americans is much more current and precise.
Why should we care?
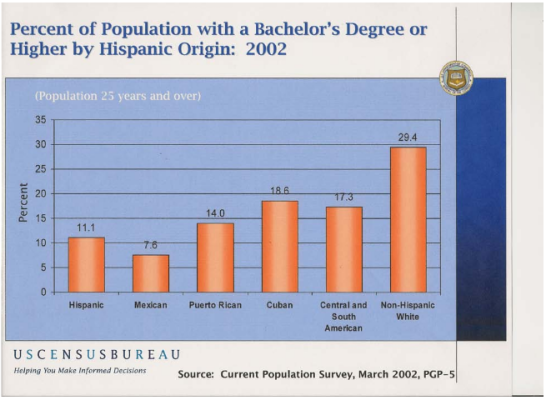
From the year 2,000 to the present, Mexicans 25 years and older had the lowest proportion of Hispanics with a bachelor’s degree or more.
Census Bureau 2000 Demographic Profile characteristics: Race, ethnic, or ancestry group.
Then and now: Have Mexican- American Professionals grown in numbers since 2004?
The answer is yes, but not by much.
- In 1985 the educational attainment of Mexican-Americans 25 years or older was 5.5%
- In 1989 it was 6.1%
- In 2,000 it was 7%
- In 2002 it was 7.6%
- During the years 2005 to 2007 it was 6.0%
- In 2007 it was 6.2%
You may ask; why did the numbers drop from 2002 to 2005?
The reason is that these are percentages of the total Mexican- American population which in:
- 2002 numbered 25.1 million
- 2005 numbered 28.1 million
- 2007 numbered 29.1 million
Between 2002 and 2005 there was an increase of 3 million Mexican-Americans, therefore the growth among Mexican-American college graduates had to increase by that proportional amount and obviously, it did not.
How do percentages of Mexican- American college graduate students compare with non-Hispanic groups? The chart below shows how the two groups compared in 2002.
Census Bureau 2005-2007 American Community Survey 3-Year Estimates.
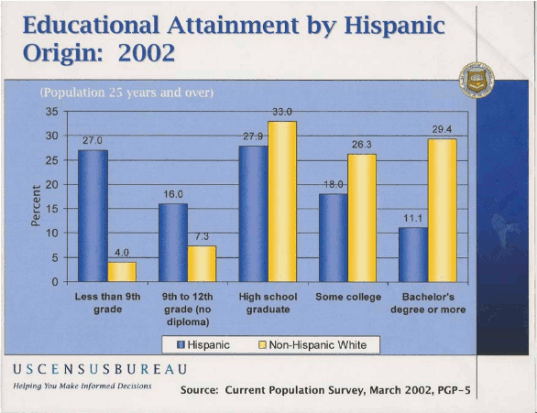
Other years we can compare the contrast between Mexican-American and Non-Hispanic groups that have attained a B.A. or more are:
In 1989 21.1 % of the non-Hispanic group had earned a B.A. or more, compared to 6.1 for Mexican-Americans.
- In 2,000 24.4% for non- Hispanics and 7% for Mexican-Americans.
- In 2,002 29% for non-Hispanics and 7.6% for Mexican Americans.
From 2005 to 2007 it was 27% for non-Hispanics and 6% for Mexican-Americans. The percentage of Non-Hispanic white is 29.4 compared with 11.1 for Hispanics and 7.6 for Mexicans.
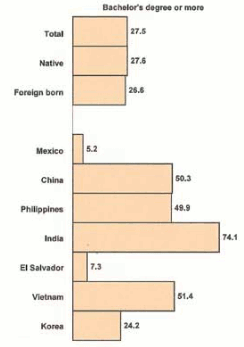
Foreign born Mexican-American fared even worse. In 2007 Educational Attainment by Mexicans at the B.A. degree or more was only 5.2%.
Census Bureau, Foreign Born Population in the United States: 2003.
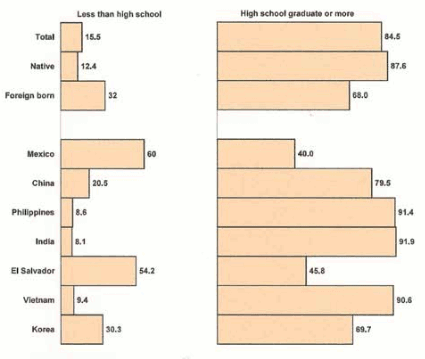
Educational Attainment by Nativity, Showing Countries of Birth of the Foreign-Born Population with 1 Million or More: 2007
What are some reasons for the great discrepancy between Mexican-American and Mexican academic achievement and Non-Hispanic populations?
One possible explanation is that Mexican-Americans are mostly employed in service, precision, production, craft and transportation jobs. This means that both Mexican groups have limited economic resources to fund their college careers. To this point, the Hispanic-Serving Institution Program found in areas which service Hispanics, funds Hispanics who want to attend college. There is a statistical chart entitled “Location of Hispanic-Serving Institutions of Higher Education in the United States by State and Percentage of Latino Undergraduates Enrolled 2003 to 2004”. This data can be found at the National Center for Education Statistics IPEDS Survey 2003 to2004.
One last comment.
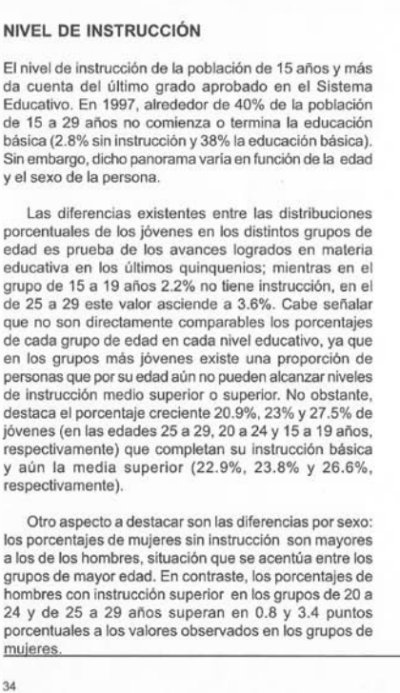
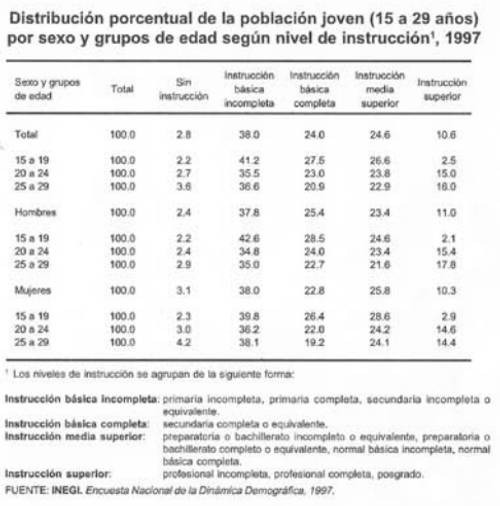
It is interesting to note that the level of students in Higher Education (Instruccion Superior) in Mexico for 25 to 30 year olds is 16% of the total Mexican population.
Los Jóvenes en México, Instituto de Estadística Geográfica e Informática. PDF file, starts on P174.
In summary:
We have made some progress filling in the gap between Mexican-American professionals (6.1% in 1989) to (6.2% in 2007) and Non-Hispanics which in 2007 number 27%. At this pace it would take Mexican-American 27 years to catch up with the Non-Hispanic population.
Sources:
- Census Bureau 2000 Demographic Profile characteristics: Race, ethnic, or ancestry group.
- Census Bureau 2005-2007 American Community Survey 3-Year Estimates.
- Census Bureau, Foreign Born Population in the United States: 2003. Slide show.
- Census Bureau, Social and Economic Characteristics of the Hispanic Population: 2006. Table 39.
- Los Jóvenes en México, Instituto de Estadística Geográfica e Informática. PDF file, starts on P174.
These PDF files are the complete documents, parts of which were used to write the above article.
- Census Bureau, Percent of Persons 25 Years Old and Over Who Have Completed High School or College, by Race Hispanic Origin and Sex: Selected Years 1940 to 1990. PDF file.
- Census Bureau, Hispanic Population in the United States: 2002. Current Population Reports. PDF file
- Census Bureau, Educational Attainment in the United States: 2003. PDF file.


