Mexican American Professionals: Clarification
The previous two articles I wrote regarding Mexican American Professionals were based on a broad definition of professionals. I used our population with college degrees or higher as the bases for my articles. Since then I have obtained new data from the Bureau of Labor Statistics to broaden my definition of Mexican American Professionals to include most individual who are employed as doctors, teachers, lawyers, etc. (see the list of professions on the next page to the article)
In 2007 the total white employment for age 16 years and over was 146,047,000.
The total employed persons of Mexican ancestry was 12,908,000, or about ten percent of the white employed population. The total Non-Hispanic white population in 2007 was 199.1 million and for Mexican Americans it was 29.1 million.
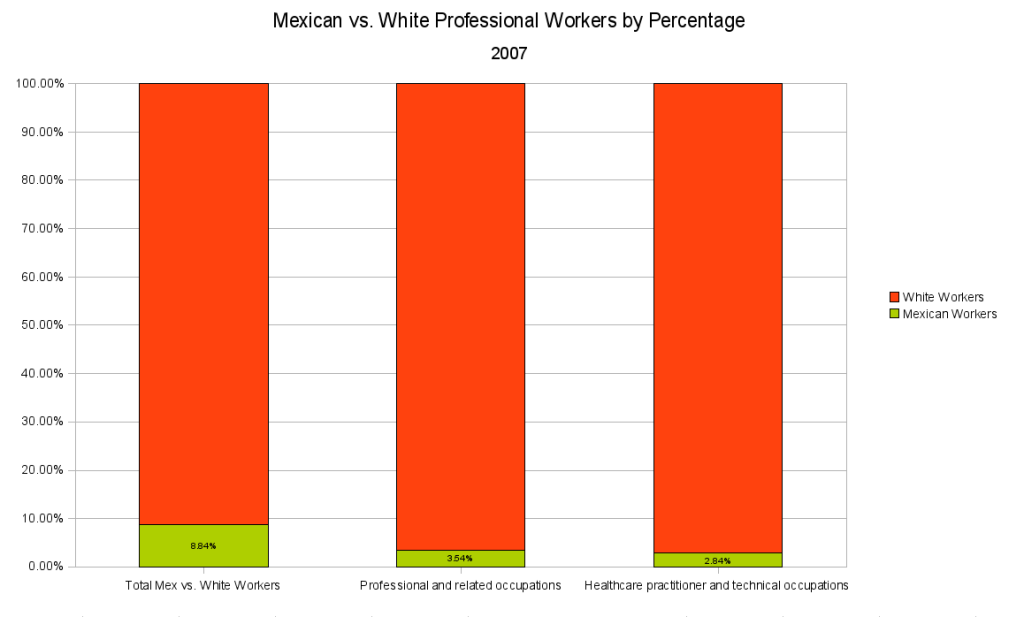
If you compare the percentage of Mexican Americans vs. White Professional workers:

Mexican vs White Professional Workers by Percentage 2007
The chart shows what minuscule portion of employed professionals Mexican Americans occupy. Mexican Americans were only 3.63% of Professionals in 2008 as compared to the total Mexican American vs. white worker population which is about 8.84%. The Healthcare field shows only a 6.69% showing among this professional group.
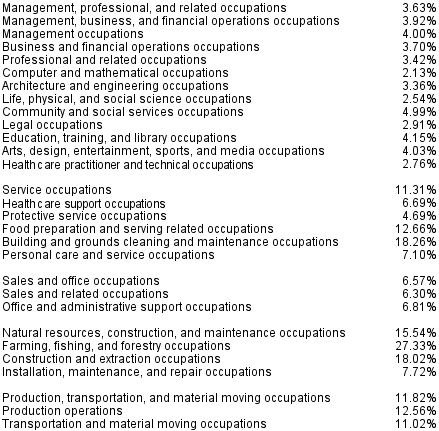
The following chart is a detailed comparison of the percentage of Mexican Americans vs. White Professional workers. It is significant to note that among professionals Mexican Americans represent only 2.13% of employed professionals as compared to White workers in computer and mathematical occupations while in service occupations such as farming, fishing and forestry they weigh in at 27.3%.

Mexican vs White professional workers detailed breakdown 2007
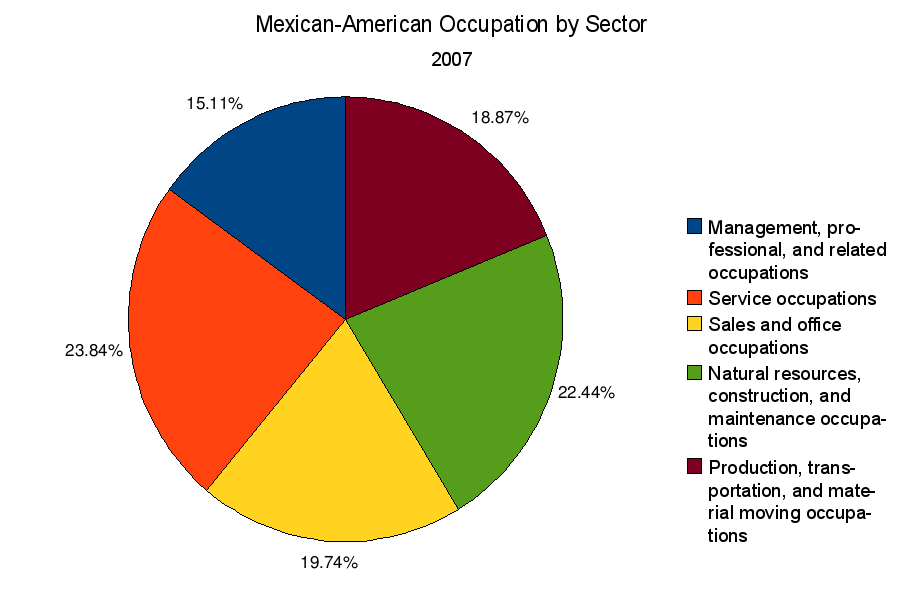
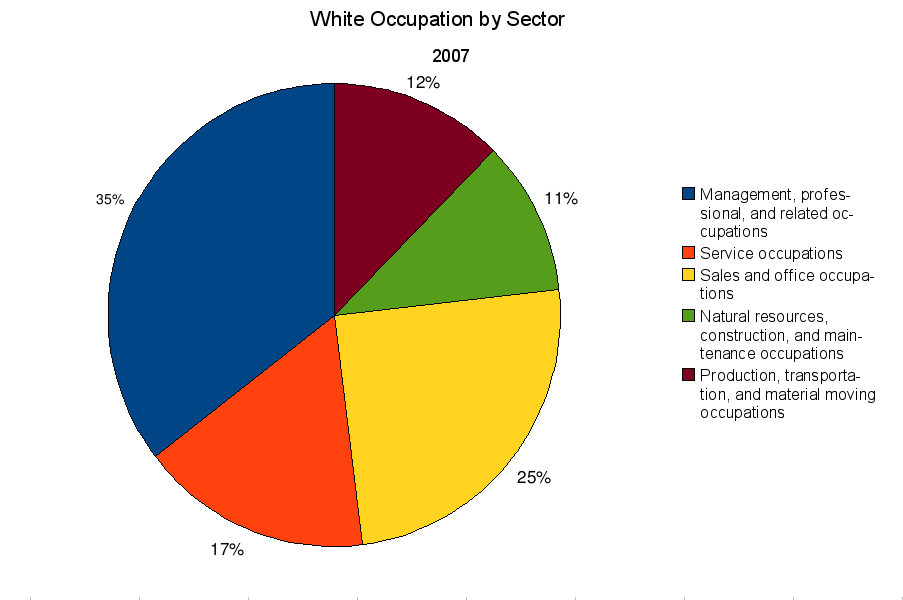
The following charts show the distribution of Mexican Americans and White workers by sector.

Mexican American occupation by sector 2007

White American occupation by sector 2007
These charts show the distribution of occupations and it is clear to see the disparities in management and professional occupations. 15% of Mexican Americans are involved in management and related fields where 35% of Whites are professionals. Roughly 24% of Mexican American workers are employed at service occupations whereas less than 17% of White workers are doing those jobs.
H1.western { font-family: “Cambria”, serif; font-size: 16pt } H1.cjk { font-family: “Times New Roman”, serif; font-size: 16pt } H1.ctl { font-family: “Times New Roman”, serif; font-size: 16pt } P { margin-bottom: 0.08in } –>
One final note
It is interesting to note that in 2008 there are (0) averages for Mexican Americans involved in the following professions:
-
Funeral directors
-
Financial examiners
-
Mathematicians
-
Actuaries
-
Agricultural Engineers
-
Biomedical Engineers
-
Mining and geological engineers, including mining safety engineers
-
Nuclear engineers
-
Conservation scientists and foresters
-
Physical scientists
-
Sociologists
-
Urban and regional planners
-
Nuclear technicians
-
Directors, religious activities and education
-
Archivists, curators, and museum technicians
-
Media and communication equipment workers
-
Podiatrists
-
Audiologists
-
Health diagnosing and treating practitioners
-
Fish and game wardens
-
Ship and boat captains and operators
Conclusions and Prospects
If you examine the trend for the years from 2007 to 2008 it’s not an optimistic one. In the chart Management and professional occupations the numbers are not moving up from year to year and in some cases the number have gone down.
I have not read any studies that nail down why these numbers are not showing improvement, but there are some writers who do offer some explanations.
Mitchell A. Kaplan in an article for the Hispanic Outlook on March 3, 2009 states that Hispanics face five major social and economic barriers to educational opportunity. They are:
-
Lack of supportive social and economic resources….
-
The immigrant and socioeconomic status of their parents.
-
The lack of parental knowledge of the internal workings of the American educational system.
-
Inadequate school resources to help compensate for educational disparities.
-
Weak relationships that Hispanics form with their teachers that tend to undermine their success.
Once again, please note that the above statements refer to Hispanic and not specifically to Mexican Americans.
It is my hope that some of these negative trends turn around. They are a reminder that great disparities in professional employment still exist between the white community and the Mexican American community.
Sources:
1. “Labor Force Characteristics by Race and Ethnicity”, 2007. U.S Department of Labor. Report 1005. P. 4, 9
2. Household Data: Annual Averages. Bureau of Labor Statistics. Employed Hispanic or Latino workers by sex, occupation, class of worker, full-or part-time status, and detailed ethnic group.


