RESULTS OF THE AMERICAN COMMUNITY SURVEY FOR 2010: a comparison of the total population of the United States and Mexican professionals
By HUMBERTO (TITO) GUTIERREZ
Edited by Carol Ponzio
Graphs by Mara Ann Fuller
The total population of the United States is 309,349,689.
The Mexican American population is 32,929,683, roughly about 11% of the total population.
The following are the results of a partial comparison of these two groups for professional occupations.
FOR EDUCATIONAL ATTAINMENT:
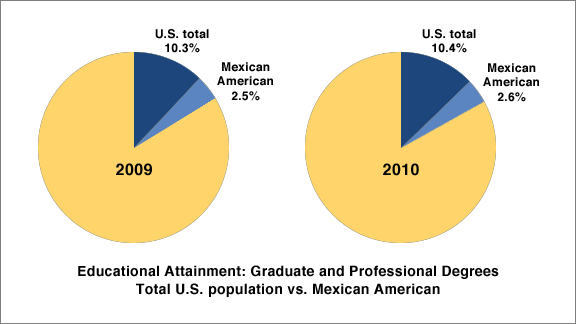
- The 2010 Graduate or professional degree was 10.4% for the total population.
- The 2009 Graduate or professional degree was 10.3% for the total population, a gain of .1% for the total population.
- The 2010 Graduate or professional degree was 2.6% for Mexican Americans.
- The 2009 Graduate or professional degree was 2.5% for Mexican Americans, also, a gain of .1%, however the gap is still 7.2% between the total population and Mexican American educational achievement in professional degrees.

These numbers have remained steady for the last two years, but when we look at the breakdown for men vs. women, the numbers are very different.
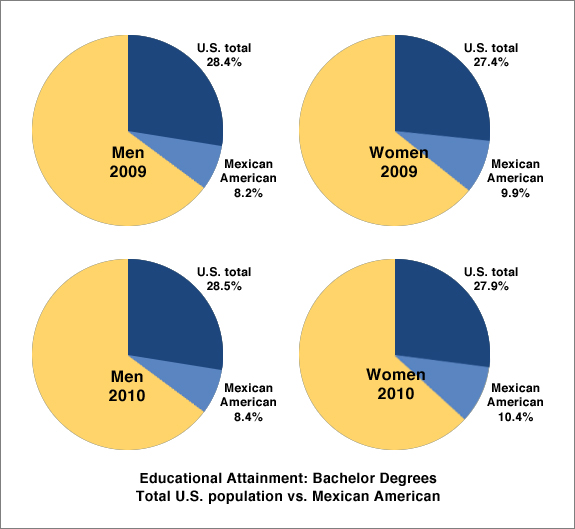
The 2009 number for male bachelor’s degrees or higher for the total population were 28.4% vs. 8.2% for Mexican Americans.
The 2009 number for female bachelor’s degrees or higher for the total population were 27.4% vs. 9.9% for Mexican American women. The difference between male and female for the total population in 2009 was in favor of males 28.4% vs. 27.4% for females. Males have a 1% advantage. In 2009 there was a 1.7% gap in favor of Mexican American females, 9.9% for women vs. 8.2% for men, a 1.7% advantage for women.
The 2010 number for male bachelor’s degree or higher for the total population was 28.5% vs. 8.4% for Mexican Americans.
The 2010 number for female bachelor’s degree or higher for the total population was 27.9% vs. 10.4% for Mexican Americans. The difference between male and female for the total population in 2010 was in favor of males, 28.5% vs. 27.9% for females, but the gap has narrowed to .6% between the genders, down from 1% in 2009. For Mexican American males the gap in 2010 is 8.4% vs. 10.4% for females, a gap of 2% in favor of females, which have gained from 1.7% in 2009 to 2.0% in 2010.

OCCUPATIONS: Male civilian employed 16 years and over:
- In 2009, management professional and related occupations results were: 32.6% for the total population, vs.12.2% for Mexican Americans.
- In 2010, management professional and related occupations results were: 32.8% for the total population, vs. 12.4% for Mexican Americans. The ratios have remained close for these groups. A gain of .2% by both groups, but Mexican American men are underrepresented by 20.4%, as compared with the total population.
OCCUPATIONS: Female civilian employed 16 years and over:
- In 2009, management professional and related occupations: total population, 39.1%, Mexican American, 21.4%.
- In 2010, management professional and related occupations: total population, 39.4%, Mexican American, 21.7%.
As a general statement the gap between the total population and women is narrower than with men. For women it’s only 17.7% instead of 20.4% for men. What is also of interest is the percentage of women vs. men in this group, which is 9.3% if favor of Mexican American women over Mexican American men.

INDUSTRY: Civilian employed population 16 years and older:
- In 2009, the results for professional, scientific, management, administrative and waste management services were 10.6% for the total populations vs. 10.1% for Mexican American.
- In 2010, the results for professional scientific, and management, and administrative waste management services were 10.6% for the total population vs. 10.1% for Mexican American population. The numbers have remained the same and are one area, which shows equality between the total population and Mexican American population.
For public administration:
- In 2009, the total population was 4.8% in public administration and 3.2% for Mexican Americans.
- In 2010, the total population was 5.2% in public administration and, 3.5% for Mexican Americans. This comparison shows that Mexican Americans lost .1% in this category.
SUMMARY
Ratios of professional employment have remained the same for the total population of the United States vs. the Mexican American population. To a large extent, Mexican American professionals remain underrepresented among professionals in general, but Mexican American women have gained ground in some areas.
Reference Documents from the U.S. Census Bureau
- Census Bureau, Selected Population Profile in the United States: 2010 (a PDF file)
- United States S0201. Selected Population Profile in the United States
Population Group: Mexican
Data Set: 2009 American Community Survey 1-Year Estimates
Survey: American Community Survey


