

Mexican American Proarchive Annual Report for 2022
The American Community Survey is an annual survey administered by the federal government to help local officials and community leaders and businesses understand the changes that take place in their communities. It includes percentages of our population’s graduate school attainment and the employment of Mexican Americans in various occupations. These important factors influence the allocation of federal resources. Mexican American Proarchives uses the data provided by the American Community Survey to better understand how Mexican Americans compare to the general population.
The primary goal of Mexican American Proarchives is to inform its readers of the percentage of Mexican Americans who obtain a graduate or professional degree. It is the main indicator of individuals employed in professions which require a degree; for example, doctors, teachers, etc. Mexican Americans are considered an underrepresented minority because their percentage of professionals when compared with the general population is very low.
The percentage of Mexican Americans vs the Total Population is 11.2%
The following are graphs which represent the contrast between the employment of the total population of the US vs the Mexican American population.
First up is:
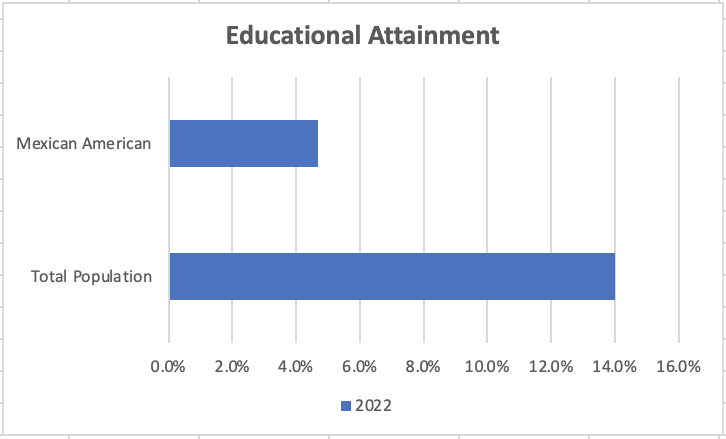
Educational Attainment for 2022 Comparison of Mexican American Attainment vs. Total Population
The total population with Graduate or professional degrees is 14.0%. Mexican Americans is 4.7%
Under Occupations:
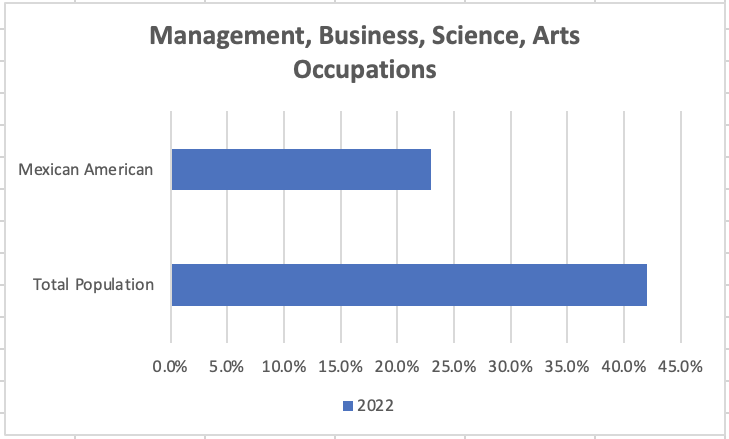
Management, business, science, and arts occupations, the total population is 42% for Mexican Americans its 23%
Under Industry:
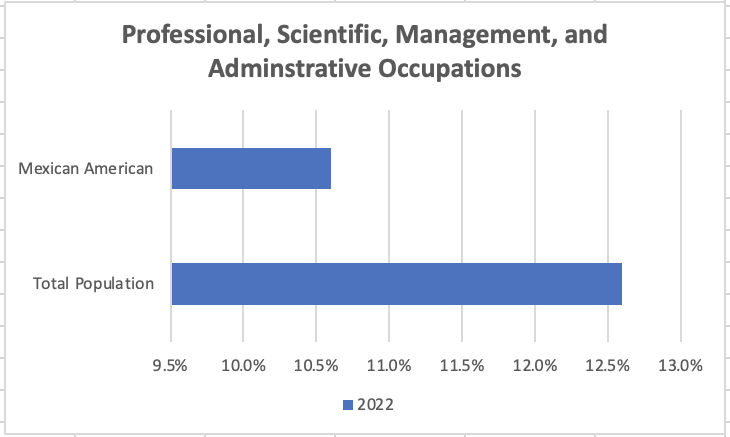
Professional, scientific, and management and administrative and waste management services, the total population is 12.6%, Mexican Americans are 10.6%
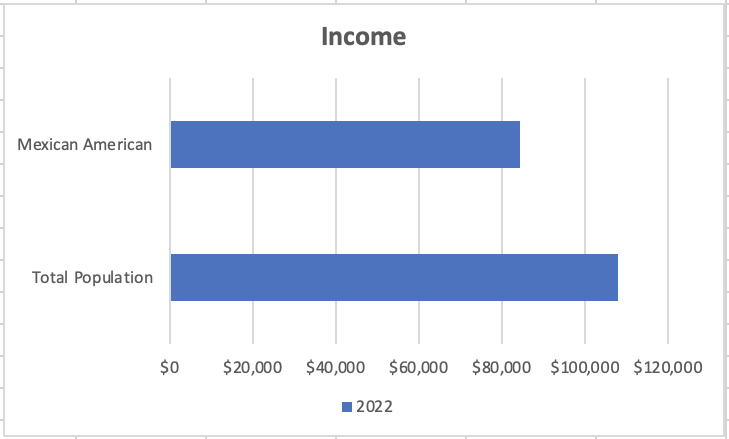
Lastly, if you compare income in dollar during the past 12 months, the total population earned $108,024, Mexican Americans, earned $84,404
First Mexican Army NCO graduates U.S. Sergeants Major Academy
“First Sgt. Gerardo Alvarado Flores became the first Mexican Soldier to graduate from the U.S. Army Noncommissioned Officer Leadership Center of Excellence Sergeants Major Academy, June 16, 2023, at Fort Bliss, Texas.
“I’m so glad to see all the international graduates because we never fight alone,” said Sgt. Maj. of the Army Michael Grinston during the ceremony recognizing the Class’s 73 graduates.
Grinston’s statement provided relevance as Alvarado became the first Mexican military graduate of the U.S. Army’s premier NCO professional development school. His graduation highlights the ongoing partnership and training with Mexico…”
https://www.dvidshub.net/news/451428/first-mexican-army-nco-graduates-us-sergeants-major-academy
Mexican American Proarchives Annual report on Mexican American Professionals for 2021
The American Community Survey is an annual survey administered by the federal government to help local officials and community leaders and businesses understand the changes that take place in their communities. It includes percentages of our population’s graduate school attainment and the employment of Mexican Americans in various occupations. These important factors influence the allocation of federal resources. Mexican American Proarchives uses the data provided by the American Community Survey to better understand how Mexican Americans compare to the general population.
The primary goal of Mexican American Proarchives is to inform its readers of the percentage of Mexican Americans who obtain a graduate or professional degree. It is the main indicator of individuals employed in professions which require a degree; for example, doctors, teachers, etc. Mexican Americans are considered an underrepresented minority because their percentage of professionals when compared with the general population is very low.
For the year 2021 the results are as follows when Mexican Americans are compared to the total population
EDUCATIONAL ATTAINMENT
GRADUATE OR PROFESSIONAL DEGREE
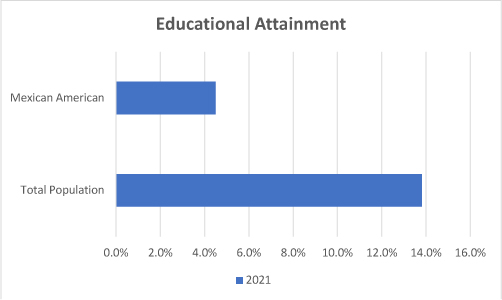
Comparison of years 2020 and 2021
Here are some examples
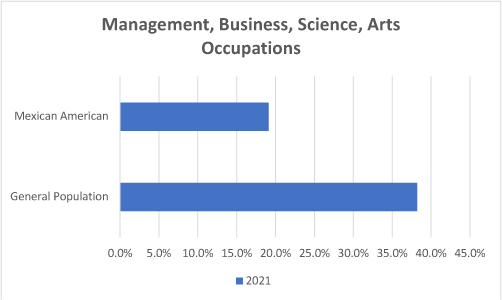
The following is a mix of occupations in which Mexican American both underrepresented and over represented.
Bar graph shows the comparison between the total population vs Mexican Americans in:
MANAGEMENT, BUSINESS, SCIENCE, AND ARTS OCCUPATIONS
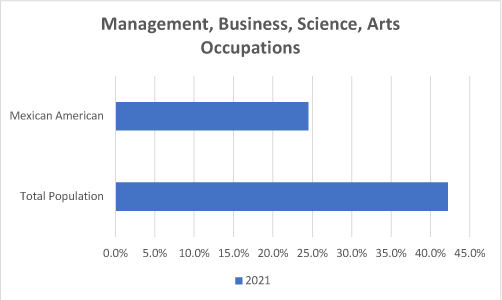
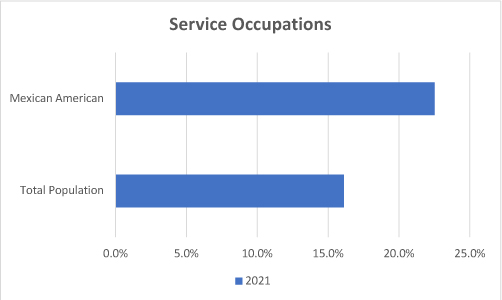
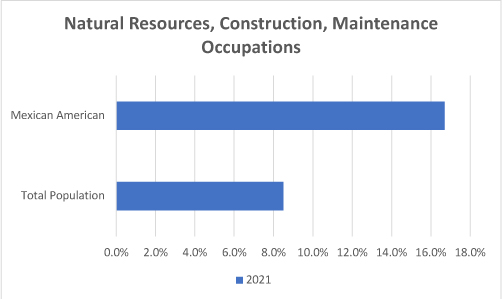
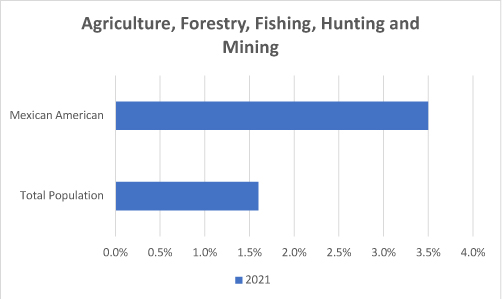
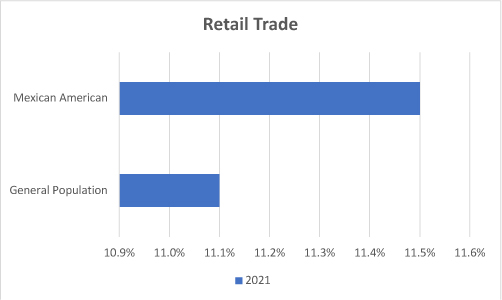
The following bar graphs show occupations in which Mexican Americans are employed at a higher percentage than the total population.
SERVICE OCCUPATIONS
NATURAL RESOURCES, CONSTRUCTION, AND MAINTENANCE OCCUPATIONS
PRODUCTION, TRANSPORTATION, AND MATERIAL MOVING OCCUPATIONS
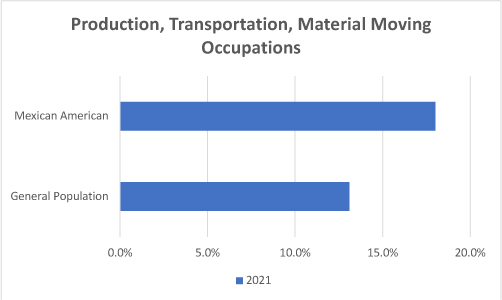
INDUSTRY
AGRICULTURE, FORESTRY, FISHING AND HUNTING, AND MININING
RETAIL TRADE
Lastly, Mexican Americans are also poorly represented in,
MANAGEMENT, BUSINESS, SCIENCE, AND ARTS OCCUPATIONS
MEXICAN AMERICAN PROFESSIONALS ARCHIVES ANNUAL REPORT
The American Community Survey for the year 2019 has reported the following results:
- Graduate School enrollment has only inched upwards in tandem with the General Population.
- Mexican American enrollment is still dismally low as compared to the General Population.
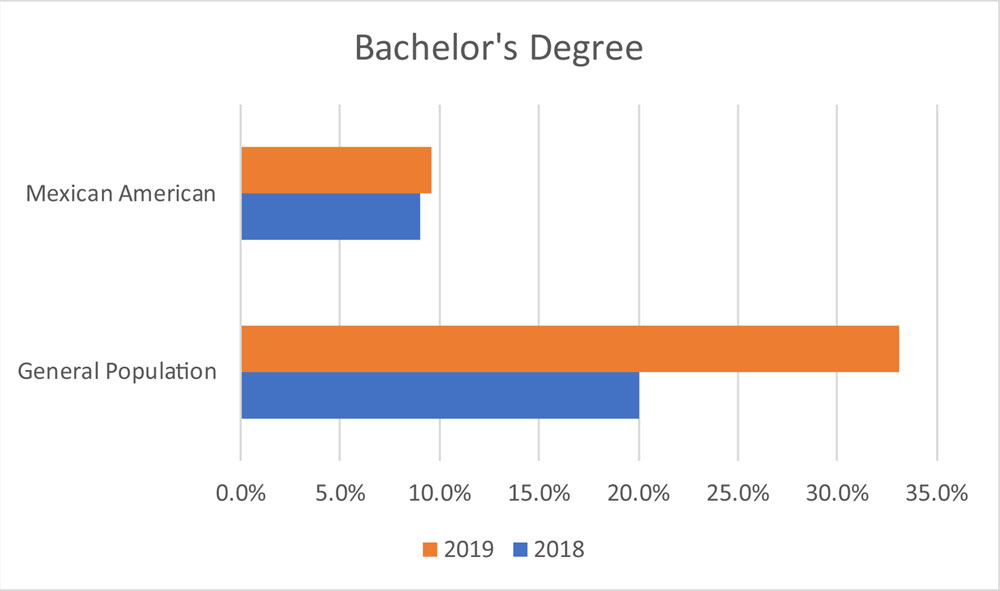
Graduations numbers for Bachelors degrees have shot up for both groups but the General Population has far outpaced the advances in Mexican American graduation rates.
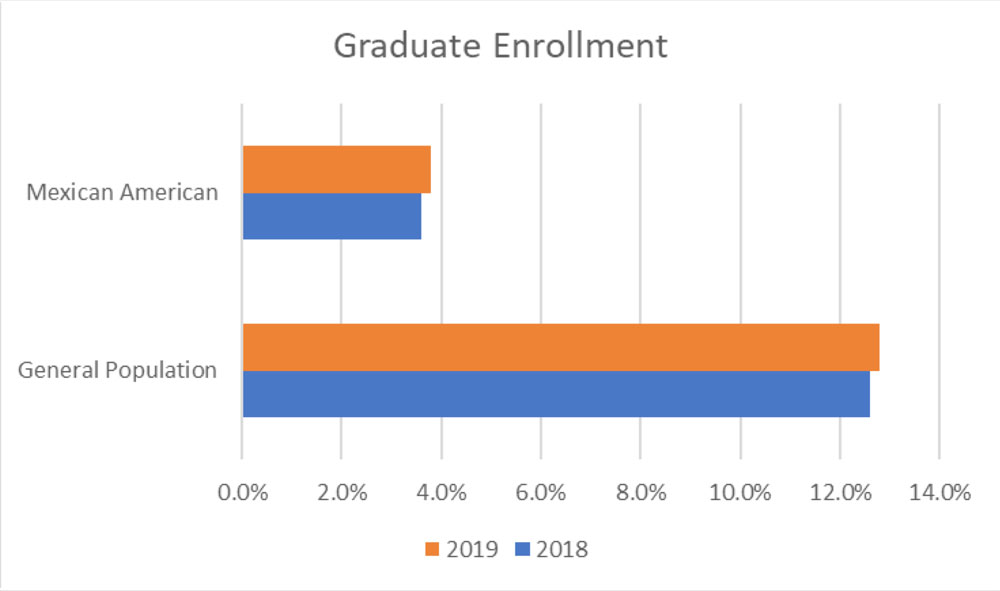
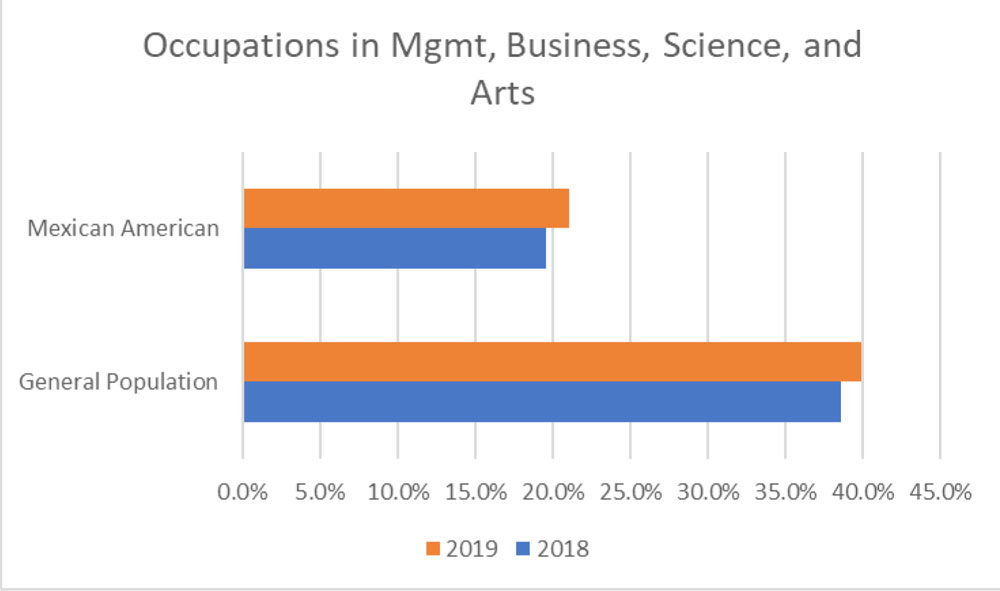
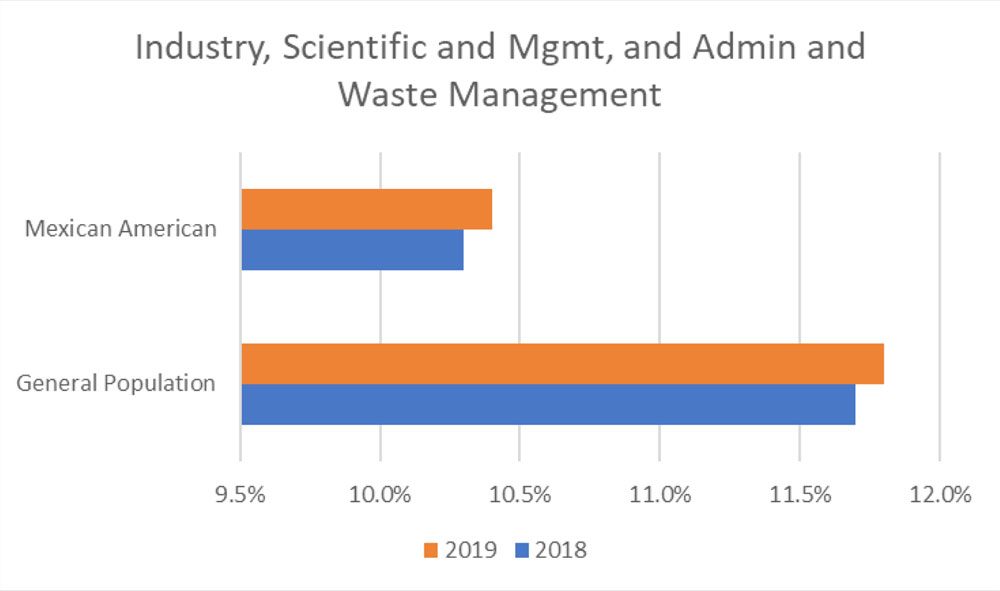
For both Occupations in Mgmt, Business, Science, and Arts, and Industry, Scientific and Mgmt, and Admin and Waste Management, Mexican American Professionals lag for behind the numbers reported for the General Population, and increases for Mexican American Professionals have been in tandem with the General Population.
MEXICAN AMERICAN PROFESSIONALS ANNUAL REPORT
The American Community Survey has reported the following results for the 2018 survey year:

It reports that the Educational Attainment for Mexican Americans was 3.6% in the United States, while for the total population of the United States was 12.6%. The good news is that it is .3% higher than it was in 2017. The bad news is that it is still way below the national figure of 12.6%.
For college graduates, specifically students graduating with their B.A. degree, it was 9% for Mexican Americans and for the total population it was 20%, which is far better than the graduate enrollment as compared above. In 2017, the figures were 8.5% for Mexican Americans and 19.3% for the total population. Still far apart, but much better than the ratio of graduate enrollment.
For the area of occupations in management, business, science, and arts the percentage was 19.6% for Mexican Americans and 38.6% for the total population.
Lastly, for industry in professional, scientific, management, and administrative and waste management it was 10.3% for Mexican Americans and 11.7% for the total population.
Compared to last year, Mexican Americans represented 10.1% in this industry verus 11.5% for the total population.
2017 annual report on Mexican American Professionals
Despite some gains, Mexican Americans continue to lag behind the general population in college enrollment, degrees and professional occupations. This has been the primary focus on my web site [https://mexican-american-proarchive.com/] and my annual reports. Herein lies the reason for my taking the time to write them.
As a Mexican American Professional (retired educator), when I first looked at the dismal numbers which compares Educational Attainment between Mexican Americans and the total populations, I was dismayed at the disparity.
The annual Community Survey published by the Census Bureau shows the following results for this year and the prior year.
The American Community census reports on college enrollment:

It is simple to observe that the total population college enrollment has decreased by .3% from years 2016 to 2017 but compared to Mexican American enrollment for 2016 the total population is 8.4% higher than the Mexican American college enrollment. On the positive side, college enrollment has gone up for Mexicans American from 19.3% to 19.6%. We will take that.
Mexican American Proarchive : Annual Report on Mexican American Professionals
It is of utmost importance to discuss why Mexican Americans have trailed most minority groups in educational achievement. The Atlantic recently published a Feb. 8, 2017 article titled “The Myth of Immigrants’ Educational Attainment,” in which new research from sociologist Cynthia Feliciano, a professor at the University of California at Irvine, “found that the reason immigrant families appear so successful is not upward mobility, but the ability to work their way into the same class they occupied in their native country.”
This is an interesting new theory that shines the light on groups such as Cubans that excel far beyond all other Hispanic groups in educational attainment.
The good news is that in spite of many explanations to the inequality between the educational attainment of Mexican Americans and the larger population in the United Sates, numbers in this educational achievement gap keep rising.
News from the American Community Census is better than last year’s. Mexican American college enrollment in the US rose from 18.9% in 2015 to 19.3% in 2016, in spite of the total college enrollment falling from 27.8% in 2015 to 27.7% in 2016.
Mexican American Pro Archive : Annual Report on Mexican American Professionals
It is of utmost importance to discuss why Mexican Americans have trailed most minority groups in educational achievement. The Atlantic recently published a Feb. 8, 2017 article titled “The Myth of Immigrants’ Educational Attainment,” in which new research from sociologist Cynthia Feliciano, a professor at the University of California at Irvine, “found that the reason immigrant families appear so successful is not upward mobility, but the ability to work their way into the same class they occupied in their native country.”
This is an interesting new theory that shines the light on groups such as Cubans that excel far beyond all other Hispanic groups in educational attainment. Continue reading
Mexican American Proarchive: Annual Report on Mexican American Professionals
News from the census American Community Survey is generally good for the 2015 year. Mexican American college enrollment was up from 18.7% to 18.9% in the 2014 and 2015 years. Graduate or professional degree attainment was also up from 2.9% to 3.0%. The number of bachelor’s degrees granted to Mexican American students rose from 7.6% in 2014 to 7.8% in 2015.
| 2012-15 COLLEGE ENROLLMENT | ||||||||
| 2012 | 2013 | 2014 | 2015 | |||||
| Total Population | Mexican Americans | Total Population | Mexican Americans | Total Population | Mexican Americans | Total Population | Mexican Americans | |
| College Enrollment | 28.80% | 18.20% | 28.30% | 18.10% | 28.00% | 18.70% | 27.80% | 18.90% |
| 2012-15 EDUCATIONAL ATTAINMENT | ||||||||
| 2012 | 2013 | 2014 | 2015 | |||||
| Total Population | Mexican Americans | Total Population | Mexican Americans | Total Population | Mexican Americans | Total Population | Mexican Americans | |
| Graduate or Professional Degree | 10.90% | 2.90% | 11.20% | 2.80% | 11.40% | 2.90% | 11.60% | 3.00% |
| Bachelor’s Degree | 18.20% | 7.00% | 18.40% | 7.30% | 18.70% | 7.60% | 19.00% | 7.80% |
| Associate’s Degree | 29.20% | 21.90% | 29.20% | 21.80% | 29.10% | 22.20% | 29.00% | 22.10% |
In spite of these gains, Mexican Americans still remain at the bottom of the ladder when it comes to earning a bachelor’s degree. Even after broadening the group to Latinos or Hispanics, this group still lags behind. According to the Pew Hispanic Center: “As of 2014, among Hispanics ages 25 to 29, just 15% of Hispanics have a bachelor’s degree or higher. By comparison, among the same age group, about 41% of whites have a bachelor’s degree or higher (as do 22% of blacks and 63% of Asians).” Pew reports that the main reasons for this low graduation rate is that Hispanics are less likely “to enroll in a four-year college, attend an academically selective college and enroll full-time.”

Also in the good news column, the University of California will continue to push for a greater number of underrepresented minorities; namely, Chicano/Latino students whose resident freshmen numbers rose from 2.7% to 32.3% of admitted California freshmen. In other good news, the proportion of Chicano/Latino students transferring from community colleges increased to 29.3% from 26.8% for 2015.
| UNIVERSITY OF CALIFORNIA | ||
| Prior to 2015 | 2015 | |
| Chicano/Latino of admitted California Freshmen | 2.70% | 32.30% |
| Chicano/Latino transferring from Community Colleges | 26.80% | 29.30% |
Occupations, including those in management, business, science, and art, fared better for Mexican Americans. The number of Mexican Americans filling these occupations rose from 17.4% in 2014 to 17.5% in 2015.
| 2012-15 OCCUPATIONS | ||||||||
| 2012 | 2013 | 2014 | 2015 | |||||
| Total Population | Mexican Americans | Total Population | Mexican Americans | Total Population | Mexican Americans | Total Population | Mexican Americans | |
| Management, Business, Science, & Art Occupations | 36.10% | 16.60% | 36.30% | 16.70% | 36.90% | 17.40% | 37.10% | 17.50% |
The total number of Hispanics filling these occupations was 16.1% in 2015, a bit lower than Mexican Americans specifically.
Percentage of industry employment that is of Hispanic or Latino ethnicity, 2014 annual averages
| Industry sector | Percent |
| Construction | 27.3% |
| Agriculture, forestry, fishing, and hunting | 23.1 |
| Leisure and hospitality | 22.3 |
| Other services | 19.0 |
| Mining, quarrying, and oil and gas extraction | 18.6 |
| Transportation and utilities | 17.2 |
| Wholesale and retail trade | 16.4 |
| Total, all industries | 16.1 |
| Professional and business services | 16.0 |
| Manufacturing | 15.8 |
| Education and health services | 11.5 |
| Public administration | 11.4 |
| Financial activities | 11.3 |
Information
U.S. Bureau of Labor Statistics
The report shows that industrial employment for Mexican Americans remained the same for 2014 and 2015 at 10.2%.
| 2012-15 INDUSTRY | ||||||||
| 2012 | 2013 | 2014 | 2015 | |||||
| Total Population | Mexican Americans | Total Population | Mexican Americans | Total Population | Mexican Americans | Total Population | Mexican Americans | |
| Professional, Scientific, Management, Administrative, & Waste Management Services, Occupations | 10.90% | 10.20% | 11.10% | 10.20% | 11.40% | 10.20% | 11.30% | 10.20% |
The figures for Hispanic or Latino employment for 2015 and 2016 show a healthy increase.
According to the Pew Hispanic center, “Construction, professional and business services, health services, financial services and food services…showed healthy gains.” Most of the jobs gained by native-born Hispanic workers were in manufacturing, mostly durable goods (82,000 Hispanic workers in this industry), followed by wholesale and retail trade (79,000), publishing, broadcasting, communication and information services (55,000), and construction (54,000).
Foreign-born Hispanics had the most job gains in construction (417,000), followed by business and professional services (179,000). Together, those two industries accounted for almost three-quarters (74%) of all jobs gained by foreign-born Latinos between 2005 and 2006.
The business and professional services sector, which ranges from management and technical services to janitorial, landscaping, and waste management services, is also a key employer for non-Hispanic workers. Of the total increase in employment in 2005-06, non-Hispanic workers accounted for 410,000 employees in the industry, native-born workers 327,000, and foreign-born workers 83,000.

Sources
Census Bureau, Selected Population Profile in the United States 2015
Pew Research Center
University of California
Bureau of Labor Statistics
New Mexico: Outstanding Multicultural State – Four Out Of Five Stars

Mural at a popular New Mexico restaurant
When I travel to Santa Fe, New Mexico, I marvel at how the Native American, Spanish, and Mexican cultures exist within one state. At least on the surface, there seems to be a great deal of respect for each other’s customs and inclusion of all culture in art and architecture.
The photo below is a good example of the blending and inclusion represented in the Zimmerman Library at the University of New Mexico campus. It shows Pueblo Revival architecture at its finest, with its heavy wood lintels to its striking viga-and-corbel ceilings.

The photo below is another good example from the Rio Grande Nature Center State Park near Albuquerque. Here we see the entrance to the center showing a corrugated culvert that was probably salvaged from a nearby acequia.

Many years before Spanish settlements, ancestral Puebloan peoples had developed an organized manipulation of water resources as early as 800 A.D.
This skill continued to be developed and by 1400 they had managed to create a gravity-fed irrigation system on the major rivers in New Mexico.
The very word acequia is from early Spanish settlements that inherited an amalgam of irrigation systems from the Roman Empire and the Moors. With the treaty of Guadalupe Hidalgo in 1848, this amalgam of Spanish and Indian laws and customs was mixed with existing American law and custom.
Beyond New Mexico’s cultural inclusiveness and diversity, there are still several areas that the state has failed at achieving.
New Mexico’s population is 47.7% Hispanic and 38.9% white (not Hispanic or Latino), but only 23.6% of firms are owned by Hispanics, and 5.3% are owned by American Indians—a very poor showing. According to the National Center for Higher Education, “New Mexico’s personal income has fallen from 83% of the U.S.average in 1960 to 74% in 2000.”
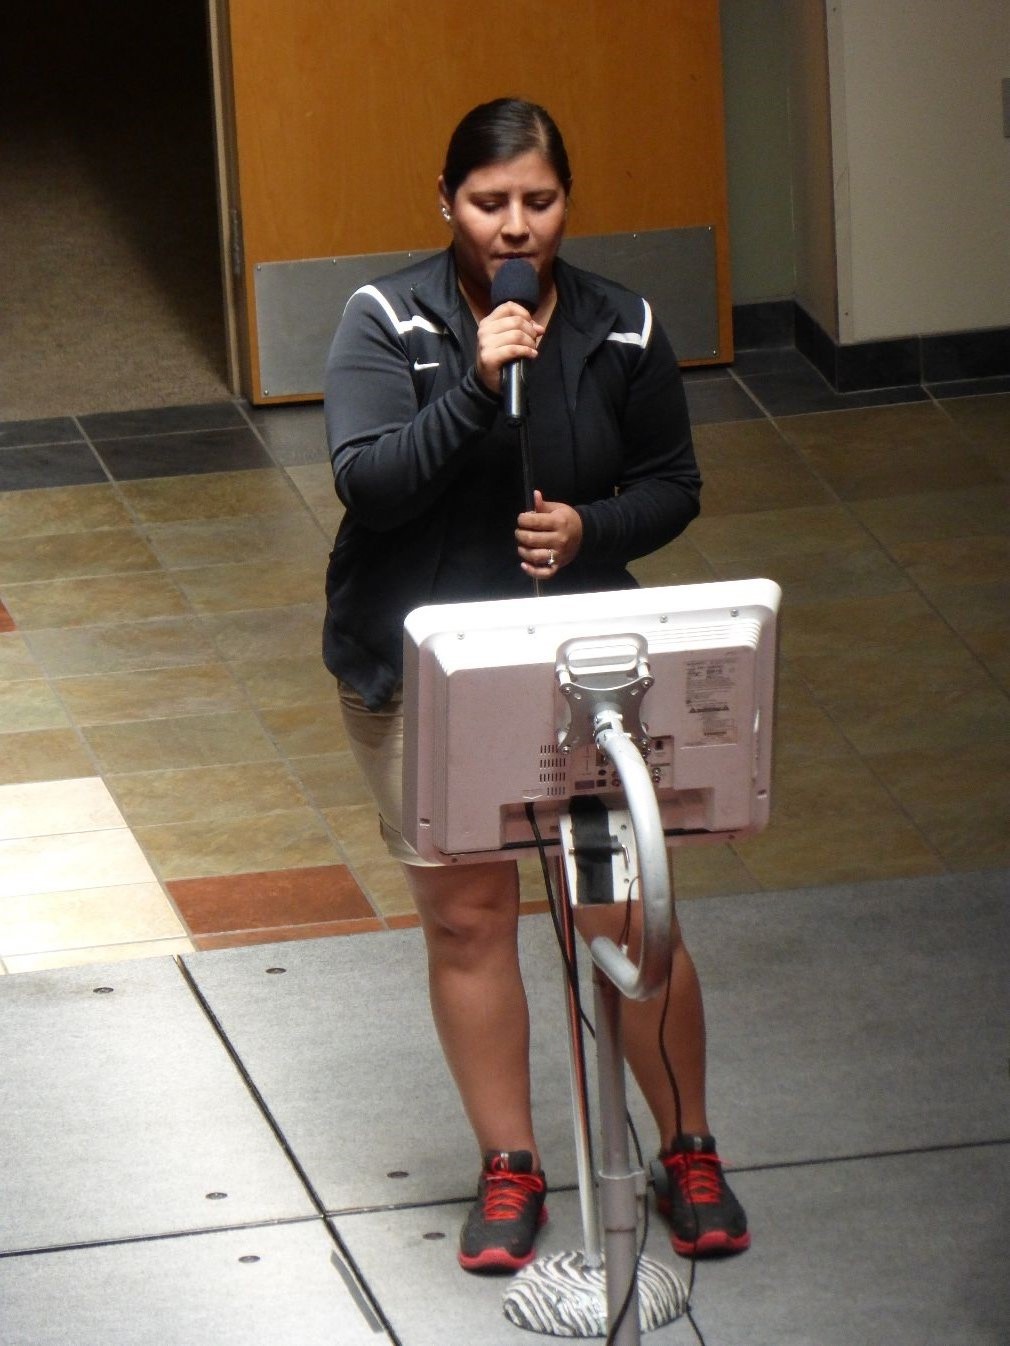
Speaker on the Student Quad at the University of New Mexico
The National Center for Higher Education also concluded: “The education system in New Mexico (from high school to college completion) fails to retain Hispanics and Native Americans at nearly the rate of whites and Asians. These racial/ethnic disparities are also evident in the graduation rates of baccalaureate students…”
In summary, New Mexico is an outstanding example of a multicultural state but has some work to be done in addressing the disparities of their majority and minority ethnic groups.
From the Delano Grape Strike to the Mexican American Vintners Association
By Humberto Gutierrez
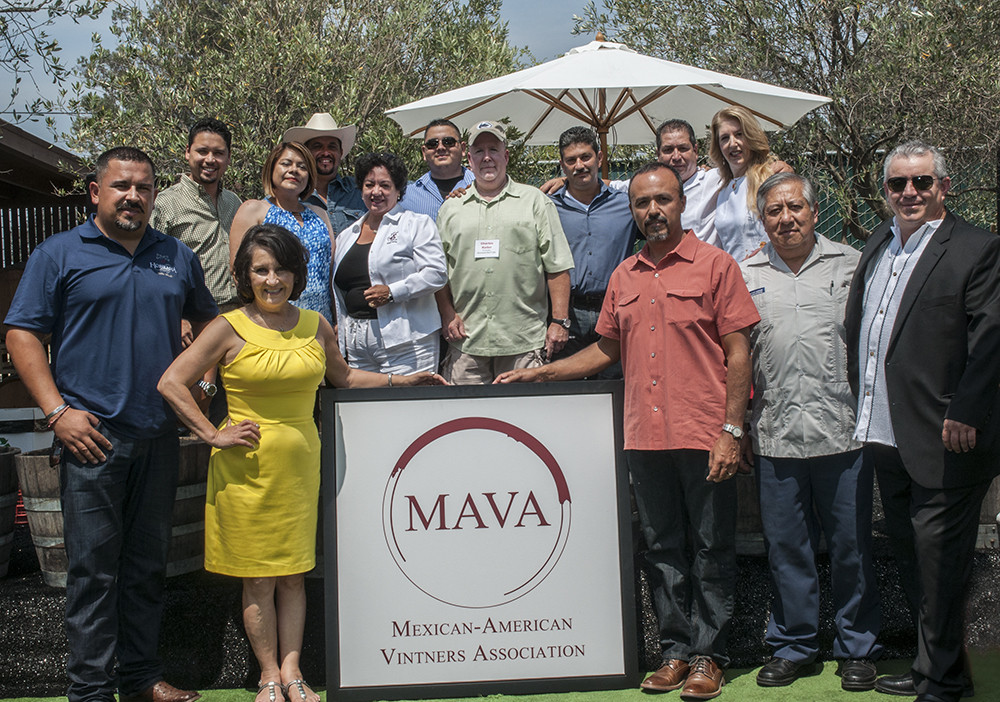
There have been several longitudinal studies on Mexican American mobility showing that although the monetary movement of Mexican Americans is not quite as rapid as that of whites, there is still a steady accumulation of wealth across generations.
This mobility is evidenced by the progress made by Mexican American professionals. As evidence of this success, we have witnessed the birth of several prominent professional associations. Most notable are:
- MAES, Latinos in Science and Engineering
- AMAE, Association of Mexican American Educators
- MABA, Mexican American Bar Association
- SACNAS, Society for Advancement of Chicanos and Native Americans in Science
- MAHPA, Mexican American Hispanic Physicians Association
- MABPA, Mexican American Business and Professional Association
- MALFA, Mexican American Latino Faculty Association
- MAVA, Mexican American Vintners Association
The latest American Community Survey shows year-to-year progress, or lack of it, on the survey’s annual census.
Prominent among this year is the continued progress of Mexican American college enrollment, which has jumped from 18.1% in 2013 to 18.7% in 2014. Unfortunately, graduate or professional degrees remain low with a small gain. For 2013, the graduate or professional degree was 11.2% and for 2014 this percentage climbed to 11.4% for the total population, while for 2013 it was 2.8% for Mexican Americans, and 2.9% for 2014.

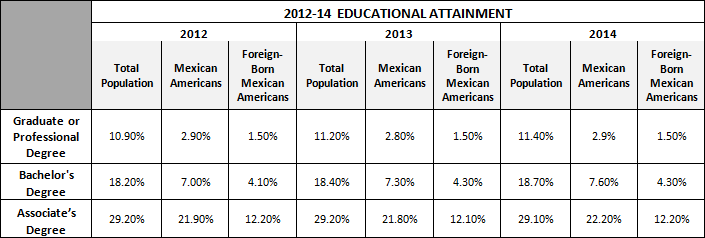
Occupations in management, business, science, and arts showed a nice increase for Mexican Americans, from 16.7% to 17.4% while for the total population percentages went from 36.3% in 2013 to 36.9% in 2014. Mexican Americans still lag far behind the total population but there is a slight gain as compared to the total population.

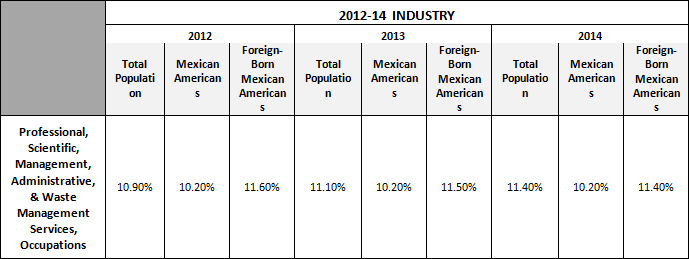
For industry, numbers have gone up slightly for the total population but have remained stagnant for Mexican Americans.
References
- Census Bureau, Selected Population Profile in the United States: 2014
- United States S0201 and B05006. Selected Population Profile in the United States
- Population Groups: Mexican and Mexico (foreign-born)
- Data Set: American Community Survey 1-Year Estimates for years 2012 and 2014
- Census Bureau, American Fact Finder, Selected Population Profile in the United States
Slow and Steady Progress for Mexican American Professionals: The results of the American surveys for the years 2010-2012 show positive results
By Humberto Gutierrez
Edited by Kristen House
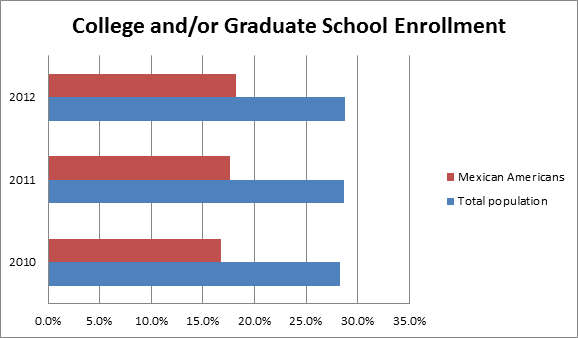
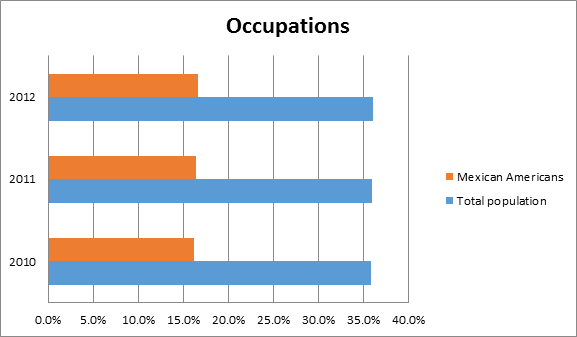
College enrollment showed an increase of 1.4 percent from 2010 to 2012—a positive sign for Mexican Americans wanting to achieve higher academic and professional goals. Here is the data.

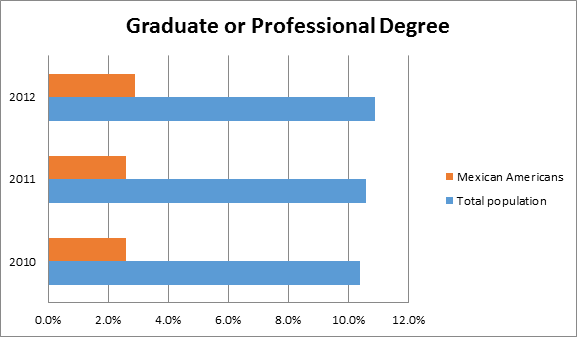
Educational attainment shows no change to the terrible numbers of 2.6 percent for the years 2010 and 2011 but there is hope in that 2012 showed a small gain to 2.9 percent.

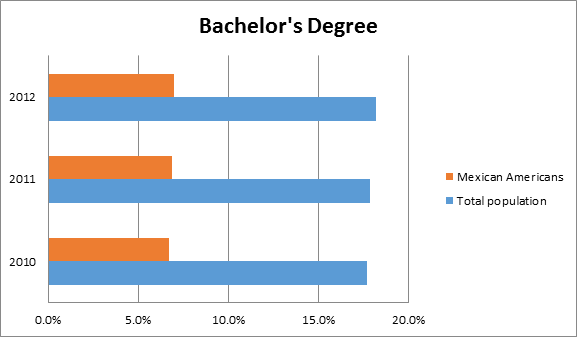
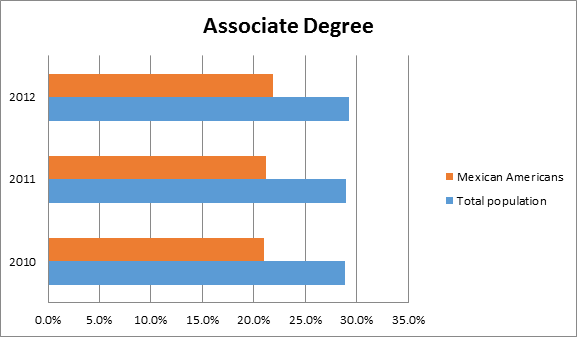
For occupations, there was a .2 percent increment yearly, but still shows that in management, business, science, and art occupations, there is still a wide gap between the total population at 36.1 percent for the year 2012 and 16.6 percent for Mexican Americans.

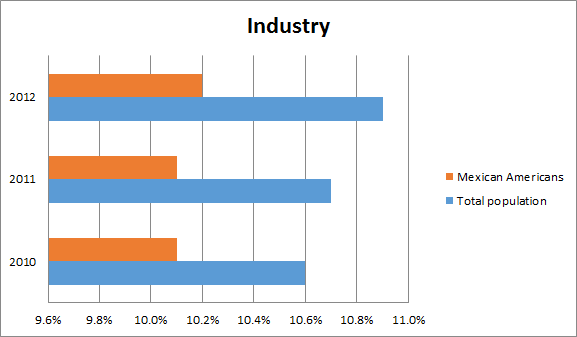
For professional, scientific, and management and administrative and waste management services, there is a close correlation between the percentage represented by the total population and Mexican Americans.

Summary:
There is hope at the end of the tunnel. College and university enrollment has been trending higher for Mexican Americans. Unfortunately, the percentage of students with graduate degrees stayed the same for the years 2010 and 2011, but rose a small amount in 2012. Percentages showing students with BA and AA degrees trended higher—an encouraging sign. Occupations still showed a wide margin between the total population and Mexican Americans. The Mexican American population showed a small increase in professional, scientific, and management and administrative and waste management employment while the total population showed a small but steady increase in this area.
References:
- Census Bureau, Selected Population Profile in the United States: 2010 – 2012
- United States S0201. Selected population Profile in the United States
- Population Group: Mexican and Total Population
- Data Set: American Community Survey 1-Year Estimates
Hopeful Gains in Higher Education for Mexican Americans
By Humberto Gutierrez
Edited by Kristen House
The latest figures from the 2013 American Community Survey show progress in the wide gap between the total US professional population and Mexican Americans:
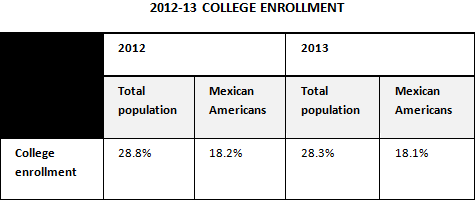
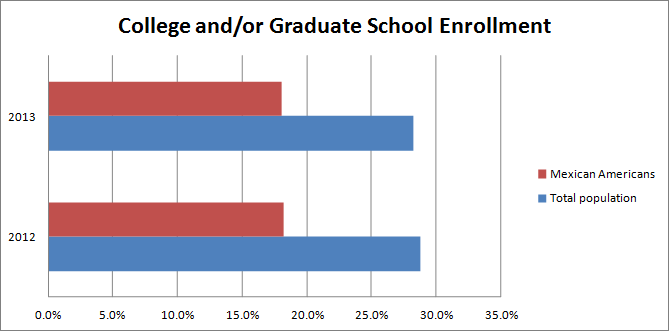
- 2012 college and/or graduate enrollment was 28.8% for the total population but only 18.2% for Mexican Americans.
- 2013 college and/or graduate enrollment was 28.3% for the total population, 18.1% for Mexican Americans, and 33.3% for foreign-born Mexican Americans.
College enrollment for the total population has decreased from the years 2012 to 2013 by 463,000 according the Census Bureau as stated in their Sept. 24, 2014 press release.
For Mexican Americans, there was also an enrollment decrease, but not as pronounced. Mexican American enrollment dropped by only .1% whereas for the total population, there was a .5% drop in college enrollment.
EDUCATIONAL ATTAINMENT
Educational attainment for the general population has risen by .3% from the years 2012 to 2013. For Mexican Americans, it has decreased by .1%
Earned bachelor’s degrees for the general population have risen by .2% and a bit more for Mexican Americans at .3%
Associate degrees and/or some college has shown little change across the board.
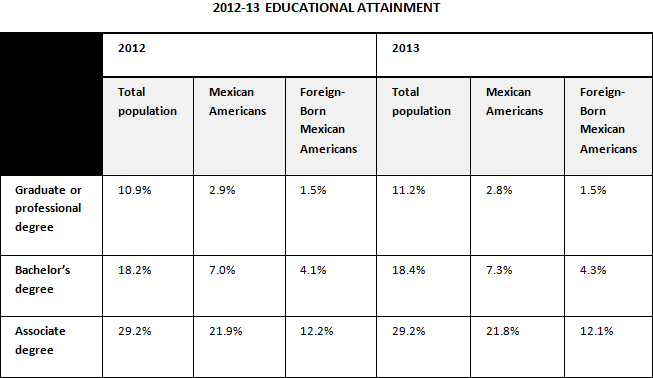
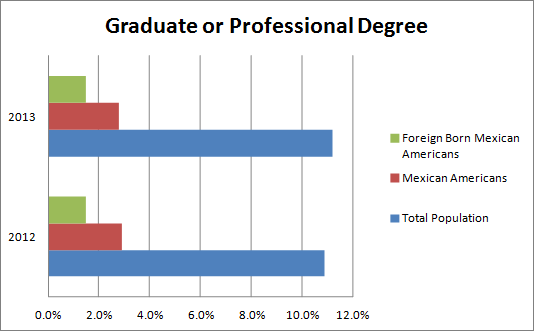
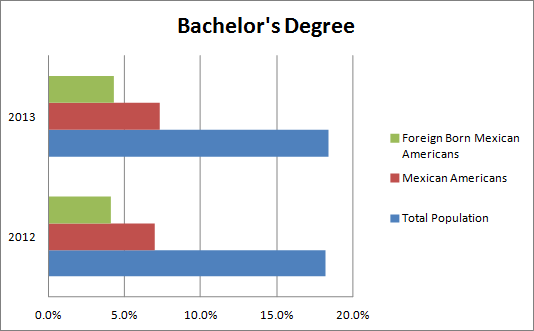
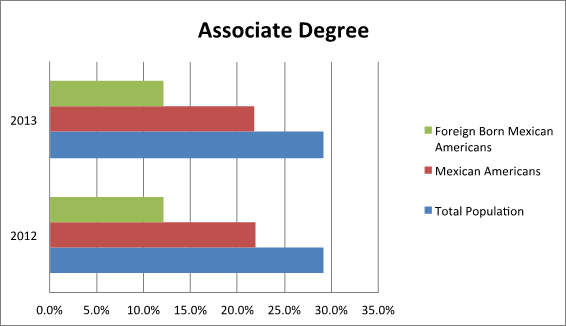
Unfortunately, only 2.8% of Mexican Americans and 1.5% of foreign-born Mexican Americans completed a graduate or professional degree in 2013. This is an extremely low percentage because the total population completion of a graduate or professional degree in 2013 was 11.2%. Why are Mexicans and native-born Mexicans not obtaining their graduate degrees? While only 7.3% of Mexican Americans have B.A. degrees, many are settling for associate degrees—21.8% of Mexican Americans and 12.1% of foreign-born Mexican Americans are ending their academic careers upon achieving these two-year degrees, according to the 2013 data.
OCCUPATIONS
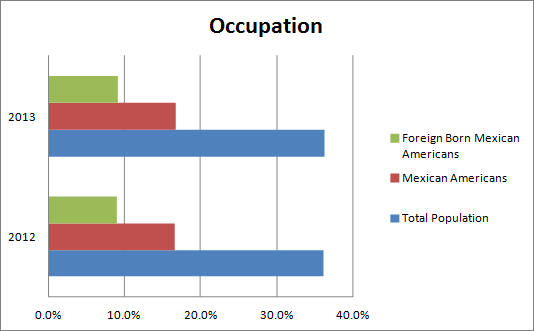
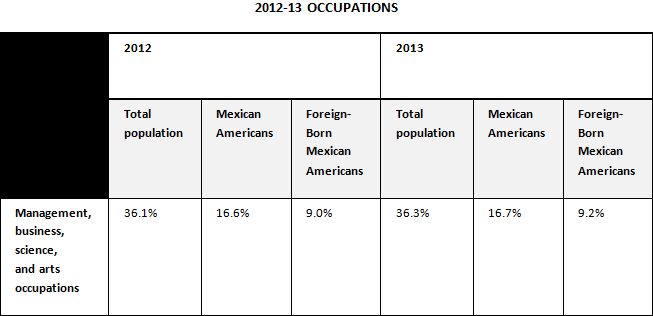
For the year 2013, the data for civilian employed population 16 years and over in management, business, science, and arts occupations is: 36.3% for the total population, 16.7% for Mexican Americans, and 9.2% for foreign-born Mexican Americans. Again, dismal figures.
Compared to the 2012 results, which were for the total population of 36.1% and for Mexican Americans 16.6%, there was a .2% increase for the total population and .1% for Mexican Americans. There was also a .2% increase for foreign-born Mexican Americans. Not much change, but some hope.
INDUSTRY
For professional, scientific, management and administration, and waste management services, 2013 employment for the total population was 11.1% and 10.2% for Mexican Americans, with foreign-born Mexican Americans at 11.5%. The 2012 results were for the total population 10.9% and 10.2% for Mexican Americans with the foreign-born Mexican Americans at 11.6%. No change for Mexican Americans and a .2% increase for the total population. However, a happy surprise: in 2013, foreign-born Mexican Americans topped all groups at 11.5% with a small decrease from 2012.
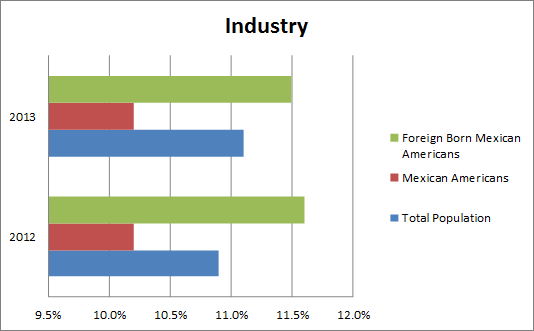
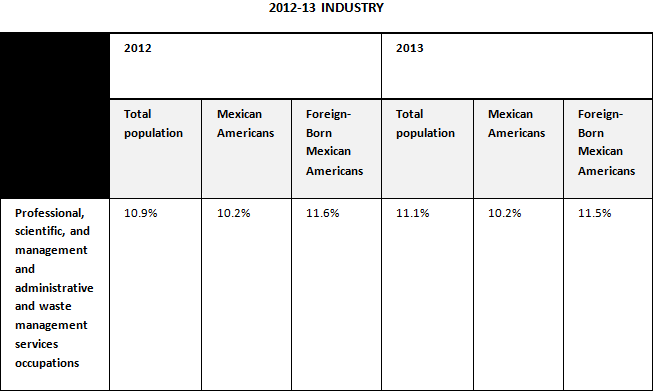
This represents a mixed picture for Mexican Americans and for foreign-born Mexican Americans in their quest for parity with the total population.
Solution for Retaining Minority Students in Higher Education
Scott Watson Swail’s 2003 report (1) on student retention programs in higher education states that a comprehensive student retention program should:
- rely on proven research
- suit the particular needs of the campus
- be institutionalized and become a regular part of campus service
- involve all campus departments and all campus personnel
- take into consideration the dynamics of the change process and provide extensive and appropriate retraining of staff
- be student centered
- operate in a cost-effective way, and not be tied to soft monies
- have the support of a comprehensive student monitoring system that will become the foundation of all institutional research on campus and support every department
- be sensitive to student needs and to diverse populations.
At least some of the above recommendations would go a long way to encourage many minority students to continue their higher education by obtaining a graduate or professional degree.
Berkley, Stanford, UCLA, and Caltech collaborate to boost minority Ph.D. students by recruiting underrepresented students in mathematical, physical and computer sciences, and in engineering.
UC Berkley put it best: “The four schools are creating a unique, cross-institutional community of underrepresented minority Ph.D. students, postdoctoral scholars, and faculty members in the targeted fields; developing faculty training to better recognize and help these students thrive and advance; and conducting research that includes annual surveys of Ph.D. students about what factors impact their attitudes, experiences and preparation for the future.”(2)
References
- Census Bureau, Selected Population Profile in the United States: 2012 and 2013
- United States S0201 and B 05006. Selected population Profile in the United States
- Population groups: Mexican and Mexico (foreign-born)
- Data set: American Community Survey 1-Year Estimates for years 2012 and 2013.
- Census Bureau, American Fact Finder, Selected population Profile in the Untied States.
————————————————–
(1) Watson Scott Swail, Retaining Minority Students in Higher Education: A Framework for Success, George Washington University, 2003
(2) Gretchen Kell, “Berkeley, Stanford, UCLA, Caltech unite to boost number of minority Ph.D. students, faculty,” UC Berkley News Center, February 13, 2014
RESULTS OF THE AMERICAN COMMUNITY SURVEY FOR 2011: a comparison of the results for the years 2010 and 2011 contrasting the total population of the United States and Mexican American professionals
By HUMBERTO (TITO) GUTIERREZ
Edited by Corrie Cripps
Mexican American women have been making slow but steady gains in business, science and art management jobs over the past few years, according to statistics from the 2011 American Community Survey conducted by the U.S. Census Bureau. However, Mexican American professionals continue to be underrepresented among the total U.S. professional population. This brief identifies areas of interest in the 2011 American Community Survey to Mexican American professionals.
Note: The statistics in this brief refer to the population who reported themselves as Mexican Americans on the American Community Survey.
According to the Survey, the total population of the U.S. is 311,591,919.
The Mexican American population is 33,557,922, roughly 10.8% of the total U.S. population.
College and/or Graduate School Enrollment
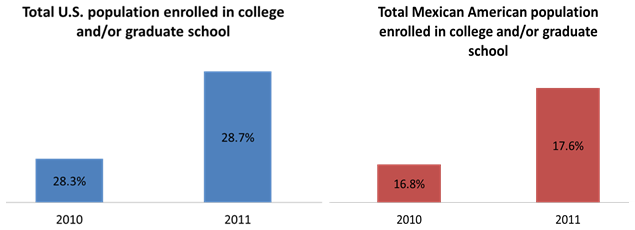
- 28.3% of the total population was enrolled in college or graduate school in 2010. In 2011, this number increased to 28.7%.
- 16.8% of the Mexican American population was enrolled in college or graduate school in 2010. In 2011, this number increased to 17.6%.
Charts: Total population enrolled in college and/or graduate school, Total U.S. population vs. Total Mexican American population
Educational Attainment:
- 17.7% of the total population earned bachelor degrees in 2010. In 2011, this number increased to 17.9%.
- 6.7% of the Mexican American population earned bachelor degrees in 2010. In 2011, this number increased to 6.9%.
- 10.4% of the total population earned graduate and professional degrees in 2010. In 2011, this number increased to 10.6%.
- 2.6% of the Mexican American population earned graduate and professional degrees in 2010, and this percentage remained the same in 2011.
Table: Educational attainment, bachelor degrees or higher
Note: In the following chart, each statistic stands for itself, i.e. do not add the male percentage to the female percentage to get a total.
Persons with a bachelor’s degree or higher are those who have received a bachelor’s degree from a college or university, or a master’s, professional, or doctorate degree.
| 2010 | 2011 | |||
| Total Population | Mexican American | Total Population | Mexican American | |
| Graduate or professional degree | 10.4% | 2.6% | 10.6% | 2.6% |
| Bachelor’s degree or higher | 28.3% | 16.8% | 28.7% | 17.6% |
| Males with bachelor’s degree or higher | 28.5% | 8.4% | 28.7% | 8.6% |
| Females with bachelor’s degree or higher | 27.9% | 10.4% | 28.3% | 10.6% |
OCCUPATIONS
Note: this data in this section includes only persons 25 years of age and older. The percentages are obtained by dividing the counts of graduates by the total number of persons 25 years old and over.
Occupations: Female employed civilians, age 25 and older:
- 39.4% of the total population of women in 2011 were employed in management, business, science, and arts occupations. Mexican American women represent 22.1% of the Mexican Americans employed in management, business, science, and arts occupations.
- Between 2007 and 2011, there has been a 1.7% increase (20.4% to 22.1%) in the number of Mexican American women employed in management professional and related occupations. In this area, the female general population figure has increased from 37.9% in 2007 to 39.5% in 2011, a 1.6% increase.
Occupations: Male employed civilians, age 25 and older:
- Between 2007 and 2011, there has been a 1.7% increase in the number of Mexican-American males in management and professional occupations.
Table: Occupations, Civilian employed population, age 25 and older
| 2010 | 2011 | |||
| Total Population | Mexican American | Total Population | Mexican American | |
| Management, business, science, and arts occupations | 35.9% | 16.2% | 36.0% | 16.4% |
| Males in management, business, science, and arts occupations | 32.8% | 12.4% | 32.7% | 12.5% |
| Females in management, business, science and arts occupations | 39.4% | 21.7% | 39.5% | 22.1% |
Industry: Civilian employed population 16 years and older:
- 10.6% of the general population was employed in the professional, scientific, management, administrative and waste management services in 2010. In 2011, this number only increased by .1% to 10.7%.
- 10.1% of Mexican Americans were employed in the professional, scientific, management, administrative and waste management services in 2010. In 2011, this percentage remained the same.
Public Administration:
- In 2010, the total population was 5.2% in public administration and 3.5% for Mexican Americans.
- In 2011, the total population was 5.1% in public administration and 3.4% for Mexican Americans. As with the Industry statistics, there was virtually no change from 2010 to 2011 in this area.
SUMMARY
Comparison of the 2010 and 2011 ratios of professionals in the general population and in the Mexican American population shows little change. In general, graduate and professional degrees among the total population are more than triple when compared with Mexican Americans who have earned graduate or professional degrees. On the bright side, there is at least one area where the ratio is almost equal; women have, again, gained ground in business, science and art management.
Reference Documents from the U.S. Census Bureau, American Community Survey
- Census Bureau, Selected Population Profile in the United States: 2011 (a PDF file)
- United States S0201. Selected Population Profile in the United States (search page)
Population Group: Mexican
Data Set: American Community Survey 1-Year Estimates (for years 2007, 2010, and 2011) - United States S0201. Selected Population Profile in the United States (search page)
Population Group: Total Population
Data Set: American Community Survey 1-Year Estimates (for years 2007, 2010, and 2011)
RESULTS OF THE AMERICAN COMMUNITY SURVEY FOR 2010: a comparison of the total population of the United States and Mexican professionals
By HUMBERTO (TITO) GUTIERREZ
Edited by Carol Ponzio
Graphs by Mara Ann Fuller
The total population of the United States is 309,349,689.
The Mexican American population is 32,929,683, roughly about 11% of the total population.
The following are the results of a partial comparison of these two groups for professional occupations.
FOR EDUCATIONAL ATTAINMENT:
- The 2010 Graduate or professional degree was 10.4% for the total population.
- The 2009 Graduate or professional degree was 10.3% for the total population, a gain of .1% for the total population.
- The 2010 Graduate or professional degree was 2.6% for Mexican Americans.
- The 2009 Graduate or professional degree was 2.5% for Mexican Americans, also, a gain of .1%, however the gap is still 7.2% between the total population and Mexican American educational achievement in professional degrees.
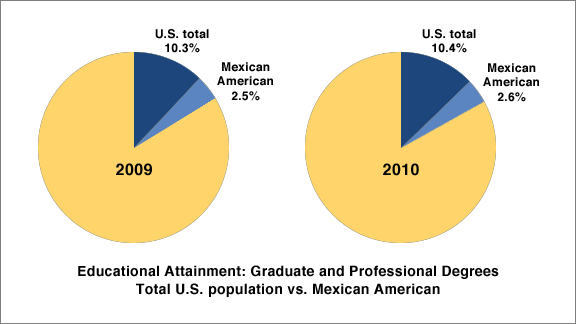
These numbers have remained steady for the last two years, but when we look at the breakdown for men vs. women, the numbers are very different.
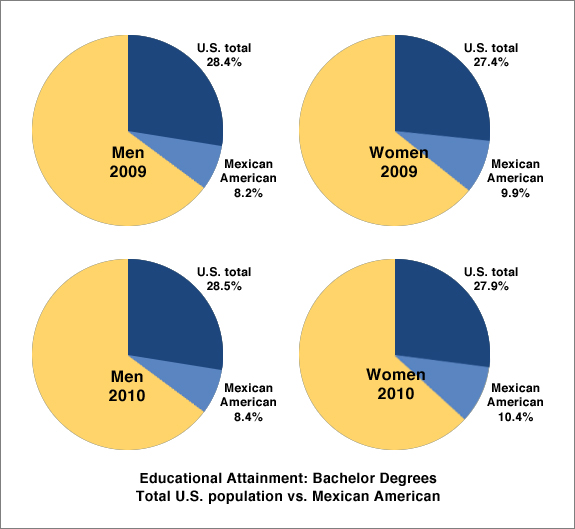
The 2009 number for male bachelor’s degrees or higher for the total population were 28.4% vs. 8.2% for Mexican Americans.
The 2009 number for female bachelor’s degrees or higher for the total population were 27.4% vs. 9.9% for Mexican American women. The difference between male and female for the total population in 2009 was in favor of males 28.4% vs. 27.4% for females. Males have a 1% advantage. In 2009 there was a 1.7% gap in favor of Mexican American females, 9.9% for women vs. 8.2% for men, a 1.7% advantage for women.
The 2010 number for male bachelor’s degree or higher for the total population was 28.5% vs. 8.4% for Mexican Americans.
The 2010 number for female bachelor’s degree or higher for the total population was 27.9% vs. 10.4% for Mexican Americans. The difference between male and female for the total population in 2010 was in favor of males, 28.5% vs. 27.9% for females, but the gap has narrowed to .6% between the genders, down from 1% in 2009. For Mexican American males the gap in 2010 is 8.4% vs. 10.4% for females, a gap of 2% in favor of females, which have gained from 1.7% in 2009 to 2.0% in 2010.
OCCUPATIONS: Male civilian employed 16 years and over:
- In 2009, management professional and related occupations results were: 32.6% for the total population, vs.12.2% for Mexican Americans.
- In 2010, management professional and related occupations results were: 32.8% for the total population, vs. 12.4% for Mexican Americans. The ratios have remained close for these groups. A gain of .2% by both groups, but Mexican American men are underrepresented by 20.4%, as compared with the total population.
OCCUPATIONS: Female civilian employed 16 years and over:
- In 2009, management professional and related occupations: total population, 39.1%, Mexican American, 21.4%.
- In 2010, management professional and related occupations: total population, 39.4%, Mexican American, 21.7%.
As a general statement the gap between the total population and women is narrower than with men. For women it’s only 17.7% instead of 20.4% for men. What is also of interest is the percentage of women vs. men in this group, which is 9.3% if favor of Mexican American women over Mexican American men.

INDUSTRY: Civilian employed population 16 years and older:
- In 2009, the results for professional, scientific, management, administrative and waste management services were 10.6% for the total populations vs. 10.1% for Mexican American.
- In 2010, the results for professional scientific, and management, and administrative waste management services were 10.6% for the total population vs. 10.1% for Mexican American population. The numbers have remained the same and are one area, which shows equality between the total population and Mexican American population.
For public administration:
- In 2009, the total population was 4.8% in public administration and 3.2% for Mexican Americans.
- In 2010, the total population was 5.2% in public administration and, 3.5% for Mexican Americans. This comparison shows that Mexican Americans lost .1% in this category.
SUMMARY
Ratios of professional employment have remained the same for the total population of the United States vs. the Mexican American population. To a large extent, Mexican American professionals remain underrepresented among professionals in general, but Mexican American women have gained ground in some areas.
Reference Documents from the U.S. Census Bureau
- Census Bureau, Selected Population Profile in the United States: 2010 (a PDF file)
- United States S0201. Selected Population Profile in the United States
Population Group: Mexican
Data Set: 2009 American Community Survey 1-Year Estimates
Survey: American Community Survey
Modern Language Association enrollments in foreign languages.
Dec 8, 2010 … Fall enrollments for 2009, released today by the Modern Language Association shows increased enrollments ..
New Statistics on Mexican American Professionals from the 2009 Community Survey
NEW STATISTICS ON MEXICAN AMERICAN OCCUPATIONS AND GRADUATE AND PROFESSIONAL DEGREES
By HUMBERTO (TITO) GUTIERREZ
Edited by Carol Ponzio
Graphs by Daniel Borg
The American Community Survey for 2009 has just been released by the Census Bureau.
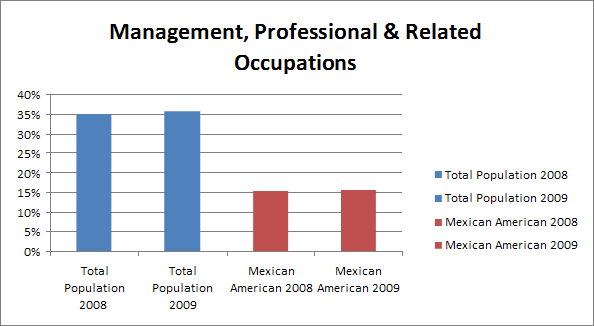
OCCUPATIONS: Management, professional, and related occupations.
A comparison of the American Survey for the years 2008 and 2009 shows that Mexican Americans have gained .3% in Management, professional, and related occupations:
2008 Total population 34.9% vs. 15.5% for Mexican
2009 Total population 35.7% vs. 15.8% for Mexican
If you look closely, the gain in the total population is .8%. This number is higher than the gain by Mexican Americans which is .3%.
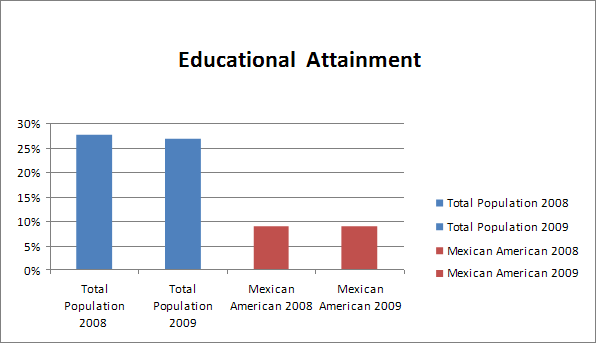
EDUCATIONAL ATTAINMENT
The results for Educational Attainment shows the following results:
Again I am comparing the years 2008 and 2009 from the American Community Survey.
Bachelor’s degree or higher
2008 Total population 27.7% vs. 9.0% for Mexican.
2009 Total population 27.0% vs. 9.0% for Mexican.
In this case there has been a drop of .7% in the total population with Bachelor’s degrees or higher. The percentage of Mexican Americans with Bachelor’s degrees or better has stayed the same at 9.0%. I will call this a small step towards improvement in our educational attainment.
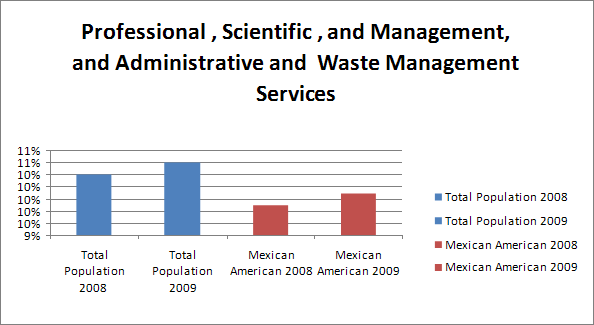
A COUPLE OF SPECIFIC INDUSTRIAL AREAS
Civilian employed population 16 years and over:
2008 Professional, scientific, and management, and administrative and waste management services
Total population 10.4% vs. 9.9% for Mexican.
2009 Professional, scientific, and management, and administrative and waste management services
Total population 10.6% vs. 10.1% for Mexican.
These numbers show that in Science, Mexican Americans are represented in fairly even percentages in contrast to the total population. The only explanation I can think of for this equality is that Language and Culture do not play as big a role in Science as they do in other occupations.
The percentages also show a slight gain for Mexican Americans from 9.9% to 10.1%, although not as much of a gain as the general population which went from 10.4% to 10.6%.
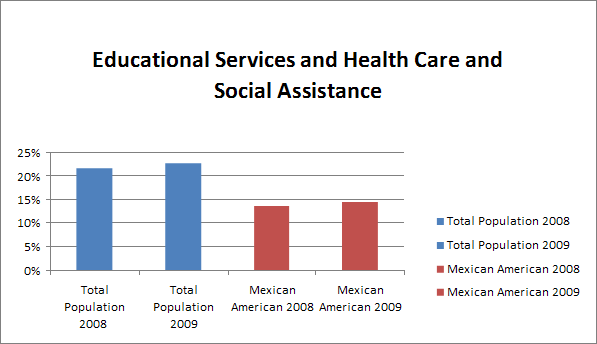
One last industry:
Educational services, and health care and social assistance.
2008 total population 21.7% vs. 13.7% for Mexican.
2009 total population 22.7% vs. 14.5% for Mexican.
Although Mexican Americans didn’t make the same gain as the general population, the gain they made was close to the gain in the general population.
Sources:
1. U.S. Census Selected Population Profile in the United States.
Population Group: Mexican
Data Set: 2008 American Community Survey
see data here
2. U.S. Census Selected Population Profile in the United States.
Population Group: Mexican
Data Set: 2009 American Community Survey
see data here
Mexican American Professionals: Clarification
The previous two articles I wrote regarding Mexican American Professionals were based on a broad definition of professionals. I used our population with college degrees or higher as the bases for my articles. Since then I have obtained new data from the Bureau of Labor Statistics to broaden my definition of Mexican American Professionals to include most individual who are employed as doctors, teachers, lawyers, etc. (see the list of professions on the next page to the article)
In 2007 the total white employment for age 16 years and over was 146,047,000.
The total employed persons of Mexican ancestry was 12,908,000, or about ten percent of the white employed population. The total Non-Hispanic white population in 2007 was 199.1 million and for Mexican Americans it was 29.1 million.
If you compare the percentage of Mexican Americans vs. White Professional workers:
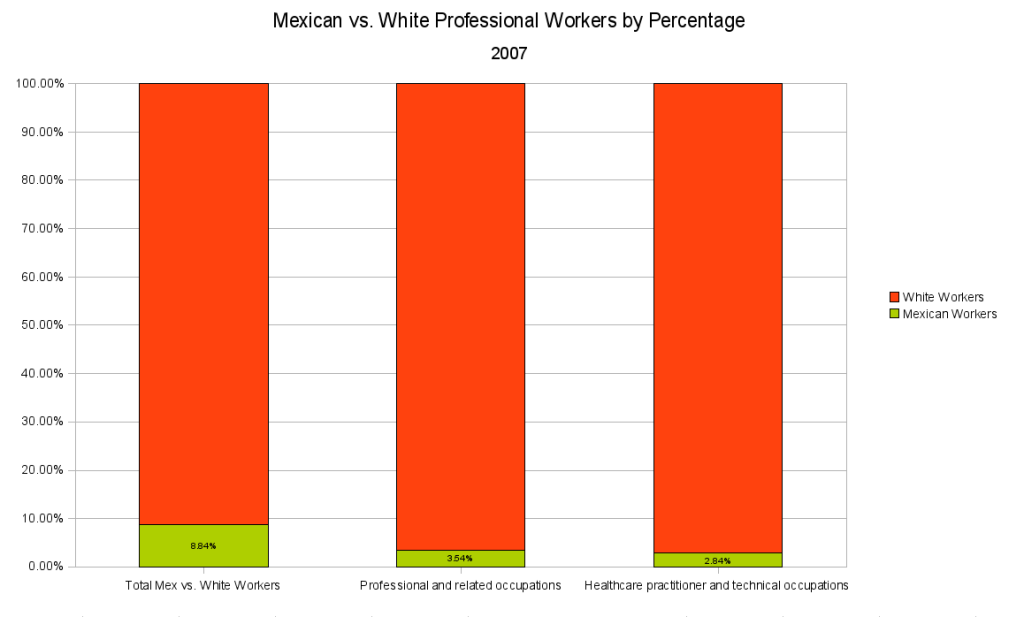
Mexican vs White Professional Workers by Percentage 2007
The chart shows what minuscule portion of employed professionals Mexican Americans occupy. Mexican Americans were only 3.63% of Professionals in 2008 as compared to the total Mexican American vs. white worker population which is about 8.84%. The Healthcare field shows only a 6.69% showing among this professional group.
The following chart is a detailed comparison of the percentage of Mexican Americans vs. White Professional workers. It is significant to note that among professionals Mexican Americans represent only 2.13% of employed professionals as compared to White workers in computer and mathematical occupations while in service occupations such as farming, fishing and forestry they weigh in at 27.3%.
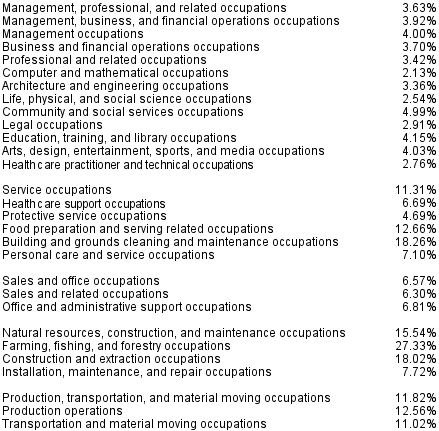
Mexican vs White professional workers detailed breakdown 2007
The following charts show the distribution of Mexican Americans and White workers by sector.
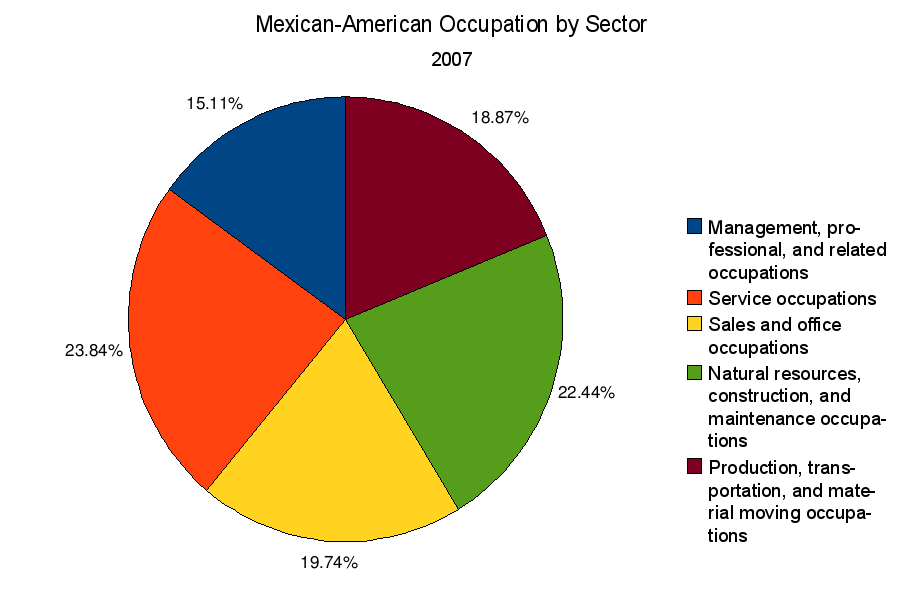
Mexican American occupation by sector 2007
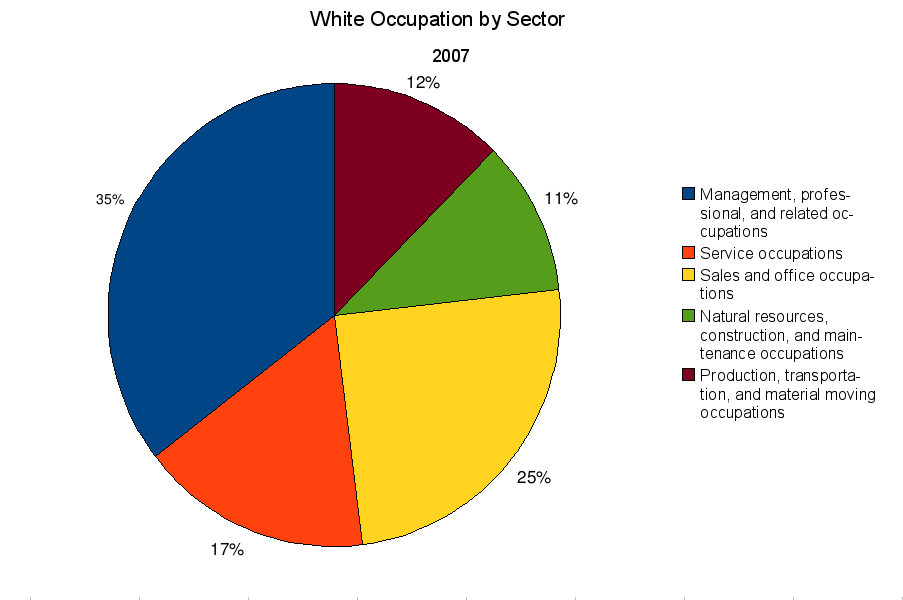
White American occupation by sector 2007
These charts show the distribution of occupations and it is clear to see the disparities in management and professional occupations. 15% of Mexican Americans are involved in management and related fields where 35% of Whites are professionals. Roughly 24% of Mexican American workers are employed at service occupations whereas less than 17% of White workers are doing those jobs.
H1.western { font-family: “Cambria”, serif; font-size: 16pt } H1.cjk { font-family: “Times New Roman”, serif; font-size: 16pt } H1.ctl { font-family: “Times New Roman”, serif; font-size: 16pt } P { margin-bottom: 0.08in } –>
One final note
It is interesting to note that in 2008 there are (0) averages for Mexican Americans involved in the following professions:
-
Funeral directors
-
Financial examiners
-
Mathematicians
-
Actuaries
-
Agricultural Engineers
-
Biomedical Engineers
-
Mining and geological engineers, including mining safety engineers
-
Nuclear engineers
-
Conservation scientists and foresters
-
Physical scientists
-
Sociologists
-
Urban and regional planners
-
Nuclear technicians
-
Directors, religious activities and education
-
Archivists, curators, and museum technicians
-
Media and communication equipment workers
-
Podiatrists
-
Audiologists
-
Health diagnosing and treating practitioners
-
Fish and game wardens
-
Ship and boat captains and operators
Conclusions and Prospects
If you examine the trend for the years from 2007 to 2008 it’s not an optimistic one. In the chart Management and professional occupations the numbers are not moving up from year to year and in some cases the number have gone down.
I have not read any studies that nail down why these numbers are not showing improvement, but there are some writers who do offer some explanations.
Mitchell A. Kaplan in an article for the Hispanic Outlook on March 3, 2009 states that Hispanics face five major social and economic barriers to educational opportunity. They are:
-
Lack of supportive social and economic resources….
-
The immigrant and socioeconomic status of their parents.
-
The lack of parental knowledge of the internal workings of the American educational system.
-
Inadequate school resources to help compensate for educational disparities.
-
Weak relationships that Hispanics form with their teachers that tend to undermine their success.
Once again, please note that the above statements refer to Hispanic and not specifically to Mexican Americans.
It is my hope that some of these negative trends turn around. They are a reminder that great disparities in professional employment still exist between the white community and the Mexican American community.
Sources:
1. “Labor Force Characteristics by Race and Ethnicity”, 2007. U.S Department of Labor. Report 1005. P. 4, 9
2. Household Data: Annual Averages. Bureau of Labor Statistics. Employed Hispanic or Latino workers by sex, occupation, class of worker, full-or part-time status, and detailed ethnic group.
The Silent Minority: Mexican-American Professionals
At last, some data
Humberto (Tito) Gutierrez
Since I wrote the first article about Mexican-American Professionals, the Census Bureau has created The American Community Survey (ACS). It …”is part of the Decennial Census Program. It is a survey that is sent to a small percentage of our population on a rotating basis. This data was previously collected only in census years in conjunction with the decennial census. Since the ACS is conducted every year, rather than once every ten years, it will provide more current data…” Given this fact, statistical information about Mexican-Americans is much more current and precise.
Why should we care?
From the year 2,000 to the present, Mexicans 25 years and older had the lowest proportion of Hispanics with a bachelor’s degree or more.
Census Bureau 2000 Demographic Profile characteristics: Race, ethnic, or ancestry group.
Then and now: Have Mexican- American Professionals grown in numbers since 2004?
The answer is yes, but not by much.
- In 1985 the educational attainment of Mexican-Americans 25 years or older was 5.5%
- In 1989 it was 6.1%
- In 2,000 it was 7%
- In 2002 it was 7.6%
- During the years 2005 to 2007 it was 6.0%
- In 2007 it was 6.2%
You may ask; why did the numbers drop from 2002 to 2005?
The reason is that these are percentages of the total Mexican- American population which in:
- 2002 numbered 25.1 million
- 2005 numbered 28.1 million
- 2007 numbered 29.1 million
Between 2002 and 2005 there was an increase of 3 million Mexican-Americans, therefore the growth among Mexican-American college graduates had to increase by that proportional amount and obviously, it did not.
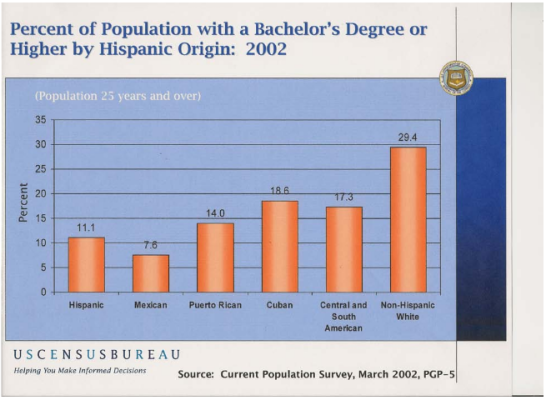
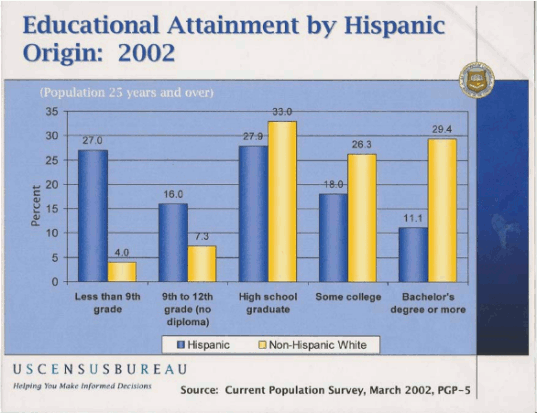
How do percentages of Mexican- American college graduate students compare with non-Hispanic groups? The chart below shows how the two groups compared in 2002.
Census Bureau 2005-2007 American Community Survey 3-Year Estimates.
Other years we can compare the contrast between Mexican-American and Non-Hispanic groups that have attained a B.A. or more are:
In 1989 21.1 % of the non-Hispanic group had earned a B.A. or more, compared to 6.1 for Mexican-Americans.
- In 2,000 24.4% for non- Hispanics and 7% for Mexican-Americans.
- In 2,002 29% for non-Hispanics and 7.6% for Mexican Americans.
From 2005 to 2007 it was 27% for non-Hispanics and 6% for Mexican-Americans. The percentage of Non-Hispanic white is 29.4 compared with 11.1 for Hispanics and 7.6 for Mexicans.
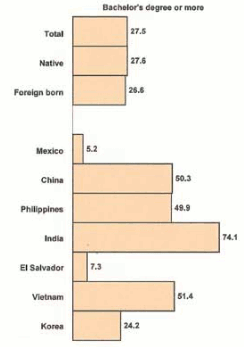
Foreign born Mexican-American fared even worse. In 2007 Educational Attainment by Mexicans at the B.A. degree or more was only 5.2%.
Census Bureau, Foreign Born Population in the United States: 2003.
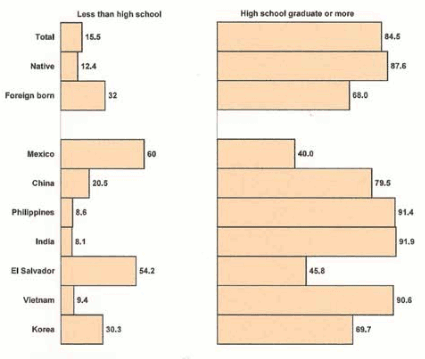
Educational Attainment by Nativity, Showing Countries of Birth of the Foreign-Born Population with 1 Million or More: 2007
What are some reasons for the great discrepancy between Mexican-American and Mexican academic achievement and Non-Hispanic populations?
One possible explanation is that Mexican-Americans are mostly employed in service, precision, production, craft and transportation jobs. This means that both Mexican groups have limited economic resources to fund their college careers. To this point, the Hispanic-Serving Institution Program found in areas which service Hispanics, funds Hispanics who want to attend college. There is a statistical chart entitled “Location of Hispanic-Serving Institutions of Higher Education in the United States by State and Percentage of Latino Undergraduates Enrolled 2003 to 2004”. This data can be found at the National Center for Education Statistics IPEDS Survey 2003 to2004.
One last comment.
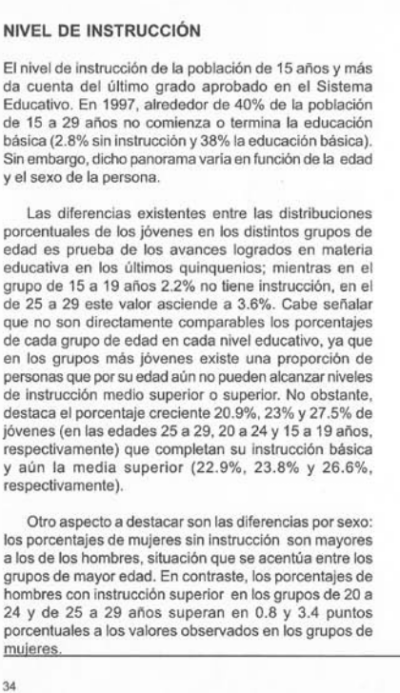
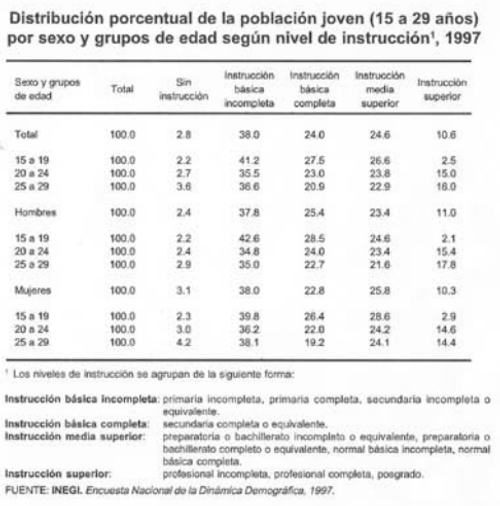
It is interesting to note that the level of students in Higher Education (Instruccion Superior) in Mexico for 25 to 30 year olds is 16% of the total Mexican population.
Los Jóvenes en México, Instituto de Estadística Geográfica e Informática. PDF file, starts on P174.
In summary:
We have made some progress filling in the gap between Mexican-American professionals (6.1% in 1989) to (6.2% in 2007) and Non-Hispanics which in 2007 number 27%. At this pace it would take Mexican-American 27 years to catch up with the Non-Hispanic population.
Sources:
- Census Bureau 2000 Demographic Profile characteristics: Race, ethnic, or ancestry group.
- Census Bureau 2005-2007 American Community Survey 3-Year Estimates.
- Census Bureau, Foreign Born Population in the United States: 2003. Slide show.
- Census Bureau, Social and Economic Characteristics of the Hispanic Population: 2006. Table 39.
- Los Jóvenes en México, Instituto de Estadística Geográfica e Informática. PDF file, starts on P174.
These PDF files are the complete documents, parts of which were used to write the above article.
- Census Bureau, Percent of Persons 25 Years Old and Over Who Have Completed High School or College, by Race Hispanic Origin and Sex: Selected Years 1940 to 1990. PDF file.
- Census Bureau, Hispanic Population in the United States: 2002. Current Population Reports. PDF file
- Census Bureau, Educational Attainment in the United States: 2003. PDF file.
The Silent Minority: Mexican-American Professionals: An Odyssey
An Odyssey in Search of Elusive Data
by Humberto Gutierrez
My Oh My, How Things Have Changed!
On a recent trip to Ciudad Juárez, Mexico, I was very surprised to observe the differences in the city where I’d spent my high school and college years.
My memories of El Paso, Texas, and Juárez, Mexico, are negative. One reason is that what was then called Texas Western College and now is The University of Texas at El Paso (UTEP) was an institution where it was almost unknown for Mexican-Americans to join any fraternity. Now I find out that UTEP has a president who is Mexican-American. Similarly, my first cousin, who was voted out when she tried to join a sorority at Texas Western, is now the proud owner of a company and has received many local business honors.
There are many other dramatic changes in these two border cities since I lived there some 30 years ago. The minority back then–Mexican-Americans–is now the majority, yet there is so little research available on Mexican-Americans and how they are progressing. This is true in El Paso, Texas, and throughout the United States.
Most literature and research fails to segregate data on Mexican-Americans from that of all Latinos or Hispanics. Also, most literature and research describes only the poor segment of our Mexican-American community, though with good reason. They are most in need. According to the figures on California during the 1990s, “The income of a family of four in the lowest quarter of wage earners fell from $28,600 to $27,000 in constant dollars.”
But it is important to know more about the group of Mexican-American professionals who are and will be more and more influential in shaping the future of our society.
In Search of Statistics
A U.S. Census Bureau report dated March 2001 stated that “Among Hispanics, 66 percent were of Mexican origin. The country’s overall Latino population was close to 33,000,000 or 12 percent of our total population.” Some scholars are saying that the census 2000 figures show the
Hispanic population at 35.3 million, about 3 million more than that estimate.
Let me here remind the reader that the real human beings behind these numbers represent the entire spectrum of historical roots that one could imagine. At one end, you have the Mexican-American whose roots reach back to the arrival of Spanish explorers on this continent. A case in point is my stepfather’s nephew, a lawyer turned teacher. His grandmother’s last name was Flores. She was a native of Floresville, Texas, a small town near San Antonio named after her family during the early Spanish Exploration of North America. On the other end of the spectrum are the newly migrated Mexican-American professionals, about whom we know so little.
The chart shows numbers of employed Mexican-Americans and Cuban-Americans and the percentage of which are managers and professionals,as reported in the 1990 Census, by gender.
Employed Hispanic persons by occupation as percent of all employed Hispanic persons by sex, by type of Hispanic origin, 1990. The numbers represent thousands.

There are far fewer Cubans than Mexican-Americans, yet they are 25.4 percent of the Hispanic managers and professionals. It is also noteworthy that males outnumber females by a ratio of almost 2- to-1.
Similar data for 1985, for both sexes, shows Hispanics of Mexican origin as 5.1 percent of all Hispanics in “executive, administrative, and managerial occupations”; those of Cuban origin, 8.3 percent; Puerto Rican, 6.4 percent; and Other Hispanic, 7.0 percent.
We might conclude that 12 years ago, Mexican-Americans were the least likely to work in managerial or professional occupations, but with ground gained since 1985.
Some figures for the year 2000 Census are available, but thus far they refer to Hispanics and are not broken into subgroups. They show that “Hispanics are less likely than Non-Hispanic Whites to work in high-paying managerial and professional specialty occupations. In 2000, 14 percent of Hispanics
were in managerial or professional occupations compared to 33 percent of Non-Hispanic Whites. Eighteen percent of Hispanic women were in managerial or professional occupations, compared to 11 percent of Hispanic men.”
The proportions for Hispanics overall are similar to the figures from the 1990 Census for Mexican-American professionals–9.6 percent for men versus 16.3 percent for women and, for Hispanics, 11 percent for men and 18 percent for women.
Data made available on March 6, 2001, tell us that “the proportion of the Hispanic population age 25 and over with at least a bachelor’s degree ranged from 23 percent for those of Cuban origin to 7 percent for those of Mexican origin, according to survey data collected in 2000 and released… by the
Commerce Department’s Census Bureau.” There is a note of caution by the Census Bureau, to wit, these are estimates, collected in the March 2000 current population survey (CPS), and should not be confused with the Census 2000 results, which are scheduled for release over the next three years.
Checking the educational attainment of the Hispanic population, 25 years old and over, by type of origin, for the years 1985 and 1989, I found that for the Cuban population, there has been a steady rise in the percentage that have completed four years of college or more. In 1985, 13.7 percent of Cubans had at least a bachelor’s degree; in 1989, 19.8 percent; and in 2000, 23 percent. For
Mexican-Americans, 5.5 percent in 1985, 6.1 percent in 1989, and 7 percent in 2000, a slower rise for Mexican-Americans, but one must consider that Mexican-Americans represent a larger population. For example, in 1989, there were 790 Cubans with at least a bachelor’s degree, but at the same time, 5,931 Mexican-Americans with bachelor’s degrees. This does not mean that we should be content with what is obviously low representation of Mexican-Americans.
Mexican Stereotypes Holding Firm
Reviewing a report in The San Francisco Chronicle on the 2000 Census for information on professionals from Mexico, I read the following:
“…For immigrants who come from poor countries with scant educational opportunities, however, job prospects in the United States can be limited. Mexicans from rural areas, for example, lack an education that has kept up with changes in technology,” said Abdiel Onate, a professor of Latin American History at San Francisco State University…“They do all the menial jobs, here,” he said. “All the labor in the kitchens of the restaurants in the Bay area, installing telephones, landscaping, gardening, construction work. Without their labor, things would be much more expensive.”
This quote speaks for itself. There is little or no mention of Mexican-American professionals. There is still the focus on the stereotypical image of the Mexican-American as being uneducated.
The article does mention that Terry Alderete, vice president of Alameda County’s Hispanic Chamber of Commerce and chief of operations for the unity council, a community development agency, “has seen a wide range of new Mexican immigrants arriving in Alameda County over the past decade,
from day laborers to business people with capital to invest…”
No mention was made of education levels that would indicate Mexican-American professionals.
But an article in the Austin American Statesman; July 12, 2001, quoting a relevant study, said: “Mexican immigrants in the U.S. are better educated than widely believed, more urban, and increasingly more likely to settle in Texas than in California… [I]t challenges long-held stereotypes and is raising concerns in Mexico about a brain-drain flowing north…. [T]he migration of highly educated Mexicans ‘has a high cost for the development of Mexico, and their loss weakens all of society.’ ‘It implies the transfer of a valuable human resource, in which our country has made a substantial investment.’ About 6 percent of all Mexicans older than 20 who have college or postgraduate (SIC) degrees now live in the United States… Mexican demographers said the study’s findings confirm anecdotal indications that they have seen for years of migrant trends shifting from rural to urban and from unskilled to professional. They attributed the brain drain to Mexican oversupply meeting with U.S. demand.”
A Phoenix/Tucson Study
Dr. Ramona Ortega-Liston published in Public Personnel Management a very interesting article entitled “Mexican-American Professionals in Municipal Administration: Do They Really Lag Behind in Terms of
Education, Seniority, and On-The-Job Training?”
The related study took place in the cities of Phoenix and Tucson.
“Separation of data by ethnicity and nativity distinguishes this study from previous research that includes all Hispanics,” she wrote. “First, Mexican nationals were separated from Mexican-Americans. Second, Mexican-American professionals were separated from all other Spanishsurnamed ethnic groups. The need for separating data by ethnicity and nativity has been recommended…because it may yield a more accurate profile of each ethnic group on specific variables examined.” She should
be applauded for this great insight but gives credit in her footnotes to others who have advanced this strategy. She also concluded that at least for that study group in Arizona, “Mexican-American managers do not appear to lag behind on important career variables such as seniority, education,
and on-the-job training…”
Science and Engineering
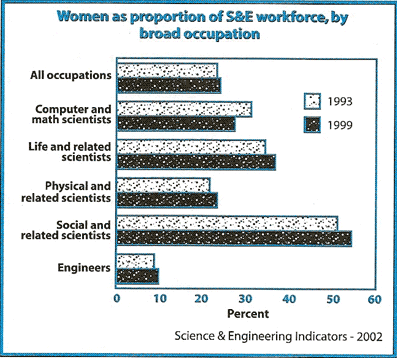
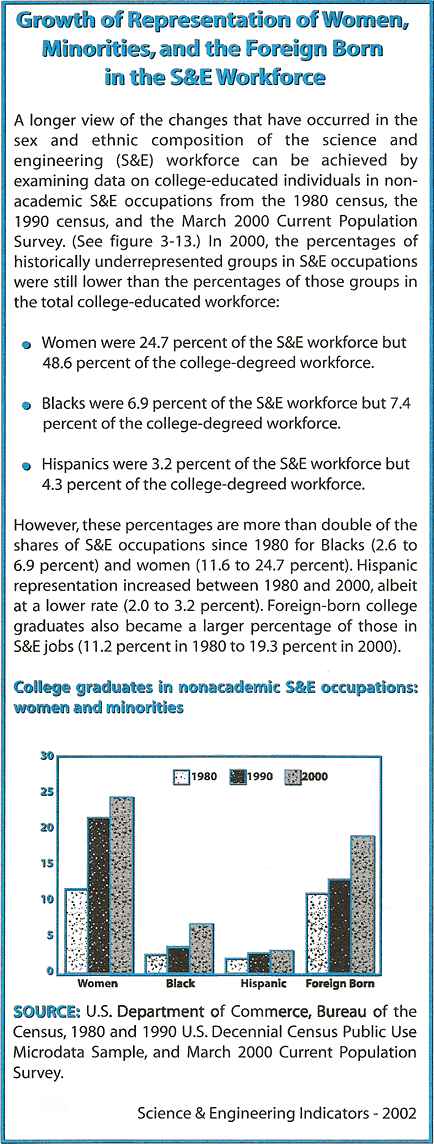
The National Science Foundation, in its Science and Engineering Indicators 2002, Vol. 2, reports that in 1999 there were 31,700 foreignborn (Mexican) U.S. residents with science and engineering degrees. This number does not include individuals with only foreign degrees who were not in the U.S. in 1990. Although this sounds like a great many, the total number of U.S. scientists and engineers in 1999 was 13,003,900. The total of foreign-born scientists and engineers is less than 1 percent.
The number of recipients of doctorates from U.S. universities who plan to stay in the U.S. and were born in Mexico remained steady, varying from 10 in 1996 to 11 in 1999.
There is no separate number for Mexican-Americans, but the total number of Hispanic science and engineering grads with earned bachelor’s degrees has grown from 9,268 in 1977 to 26,725 in 1999. Still a small fraction of the total science and engineering graduates.
By coincidence, Dr. Diana S. Natalicio, the president of my alma mater, the University of Texas at El Paso (UTEP), is a member of The National Science Board, which submits biennial science indicators and science and engineering indicators, in accordance with Sec.4(J) of the National Science Foundation Act of 1950, to the president and Congress.
It is gratifying to read that UTEP is involved in the training of engineers who work for the factories located in Ciudad Juárez, Mexico. This industry has grown to 3,500 plants along the 2,000-mile border that take advantage of cheaper labor in Mexico and the North American Free Trade Agreement
(NAFTA). UTEP has started a weekend graduate engineering program for advanced-level factory employees. About 100 engineers are participating.
Breaking Stereotypes
Hector De Jesús Ruiz, CEO of Advanced Micro Devices, is a Mexican-American engineer who represents the continuing change in our Mexican-American community. He was born in Piedras Negras, Mexico, and has a degree in electrical engineering from the University of Texas at Austin. He
tells us that what helps him get through tough times is a memory from when he was 14 years old. He recalls that “a politician was on the radio proclaiming that he represented the party of the poor and the destitute. My father said, ‘Son, when you grow up, I don’t want you to be a member of a
party that caters to the oppressed and the poor. You have to aspire to be a member of a party that is happy, winning, and influential.’” Ruiz adds that the experience stuck with him and says that he does not want to be the underdog–he wants to try to figure out how he can win big.
Conversations Across the Border
During my last visit to Ciudad Juárez, Mexico, I had the opportunity to visit a private college and prep school where my niece, Cecilia Valdez, is a teacher and administrator.
The campus is very modern, with some of the newest advances in technology that money can buy. At this institution, students are prepared for the job market in Mexico and in the U.S. The curriculum reflects both markets.
The school’s coordinator of international programs informed me that the school offers student exchange programs with Boston University, Purdue, University of British Columbia, and many other schools of higher learning throughout the world. The curriculum is accredited by the
Southwestern Association of Colleges and Universities. The coordinator told me that as many as 42 students transfer to the University of Texas at El Paso, located just across the border. The reasons for their transfer vary and include curriculum and finances. Some career tracks are not offered
at the college. Some students at the school are U. S. citizens and for them it is cheaper to attend UTEP.
I asked her about the factories along the border established through NAFTA, referred to in Mexico as “maquilas.” She told me that maquilas bring in their own professionals, according to the needs of each company. Obviously, they are a great source for all types of jobs along the border with Mexico. She had knowledge of a number of graduates who felt that there still exists prejudice against the foreign-born when applying for work in the U.S. The visa process is lengthy and costly. Her own brother, now working in Kentucky as an engineer for a Mexican company, would like to relocate in Mexico, she said.
During my visit, I also had the good fortune to talk with the coordinator of science programs for the college, who spoke about her very successful sons, both of whom work in the U.S. Her oldest earned his master’s degree from UTEP in engineering communications and studied his high school (preparatoria) in Mexico. He is now a successful design engineer in Newport Beach, Calif. Through his good academic record and teacher recommendations, he was able to qualify for a resident passport in the U.S. Her younger son was a business administration major at UTEP and earned an M.A. in accounting. He now works for El Paso Energy in Houston, Texas, and is married to a U.S. citizen, which allows him to file for his own U.S. residency.
In both situations, the quality of their lives in the U.S. far exceeds the one they would have experienced in Mexico, according to their mother. They are well adjusted to the competitive life in the U.S. and have proved that they can succeed in the U.S.
It is important to state that UTEP’s enrollment includes 1,749 students from Mexico, a 4 percent increase over last year. According to Natalicio, “These students represent approximately 15 percent of all Mexican nationals enrolled in the U.S. colleges and universities…”
Epilogue
I would like to encourage social researchers to separate data that refer to Mexican-Americans. It will help us assess the progress or lack of it of our Mexican-American community. Also, the persons who report the news in the media need to be more sensitive to patronizing and stereotyping.
My thanks to Walter Gilmore for his ideas, and to all the reference librarians at Sánchez Library, Pacifica, San Francisco State, and Skyline College. To all of you, a big Mexican hug.
References
Tyche Hendricks, “All Roads Lead to the Bay Area”, Associated Press, San Francisco Chronicle, Aug. 27, 2002, p. A12
Census Bureau SIC 926110, “Diversity of the Country’s Hispanics Highlighted in the U.S. Census Bureau Report, U.S. Newswire; March 6, 2001.
Pinto Alicea, Ines. Chapa, Flores, and Yzaguirre Press for Equity. Latino perspective on census 2000. Hispanic Outlook in Higher Education, Sept. 10, 2001 V.11; N.24 p 20.
Science and Engineering Indicators-2002. Vol. 2 p.A2-23 Garwood, Alfred. Hispanic Americans, a Statistical Sourcebook, published by Numbers and Concepts, 1991. Boulder, Colo. p. 132
US. Newswire, March 6, 2001.
Nova, UTEP Alumni Magazine. Winter 2002. p. 8
Lynn Elber, Associated Press, San Francisco Chronicle, Friday, Aug. 16,
2002, p. D 18.
San Francisco Chronicle, Aug. 27, 2002, p. A12
Susan Ferriss, American-Statesman International Staff, Austin American
Statesman; Austin, Texas; July 12, 2001, p.A4.
Ramona Ortega-Liston, “Mexican-American Professionals in Municipal Administration: Do They Really Lag Behind in Terms of Education, Seniority, and On-the-Job Training?” Public Personnel Management,
Summer 2001 V30 12 p. 197.
Science and Engineering Indicators-2002, Vol., 2, National Science Foundation, p.A169.
About the Author
Humberto Gutiérrez holds a B.A. in philosophy from UTEP, an M.A. in administration and supervision of education from CSU-Northridge, and was a doctoral candidate in both romance linguistics and philosophy of education at UCLA. His career in education spans three decades and includes teaching people of all ages, elementary and high school through college. He has developed and taught bilingual and multicultural programs at Mendocino College and throughout the L.A. Unified School District. Publications include Spanish for Our Schools and Spanish Developmental Reading Program, both for the L.A. City Schools, and Mexican-American History, for the Hispanic Urban Center.


